Bearish Pressure Persists on UMA (UMAUSD)
Estimated Reading Time: 2 minutes
Don’t invest unless you’re prepared to lose all the money you invest. This is a high-risk investment and you are unlikely to be protected if something goes wrong. Take 2 minutes to learn more
UMA Analysis – Bearish Pressure Persists as UMA Remains on a Low Plane
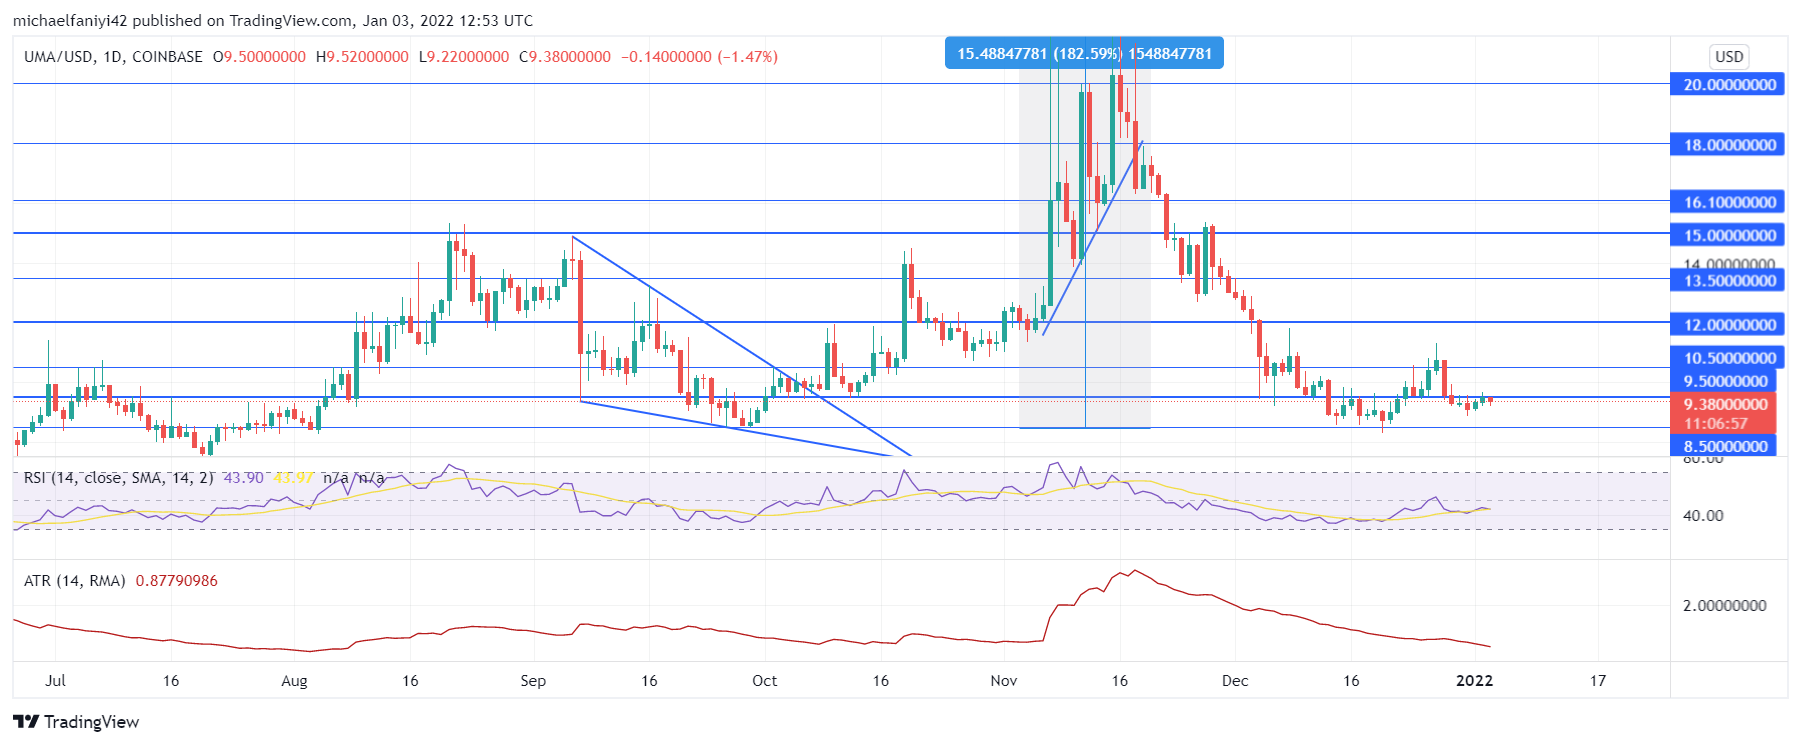
Bearish pressure persists on UMA as its latest attempt to rally comes to naught. So much pressure persists on UMA that it slides below the $12.000-$9.500 ranging zone. However, after a while, the coin tries to rally against the trend of the bearish market forces, but it only reaches around $11.000 before the market crashes again back to $9.500 and even below it. Bearish pressure continues to persist on the coin.
UMA Significant Zones
Resistance Zones: $9.500, $12.000
Support Zones: $8.500, $7.500
Sellers gained dominance shortly after a very high volatility market pump, which lifted the coin from $8.500 to $24.000 in an unprecedented 180% increase. It was such a volatile period of the UMA that it left the market’s buyers thoroughly drained. This allowed bearish pressure to come in and thrive in the market unchallenged. Thereafter, the coin fell, though with decreased volatility but in a shorter time.
As a result, UMA is back to where it started from, at $8.500. The coin has been trying to lift itself back up, but the initial bearish pressure still persists strongly in the market. This led to a failed attempt to rally. However, the RSI (Relative Strength Index) line, which forms a rounded bottom shape and is now hovering below the middle line at 50, shows there is a more bullish impetus in the market.

Market Anticipation
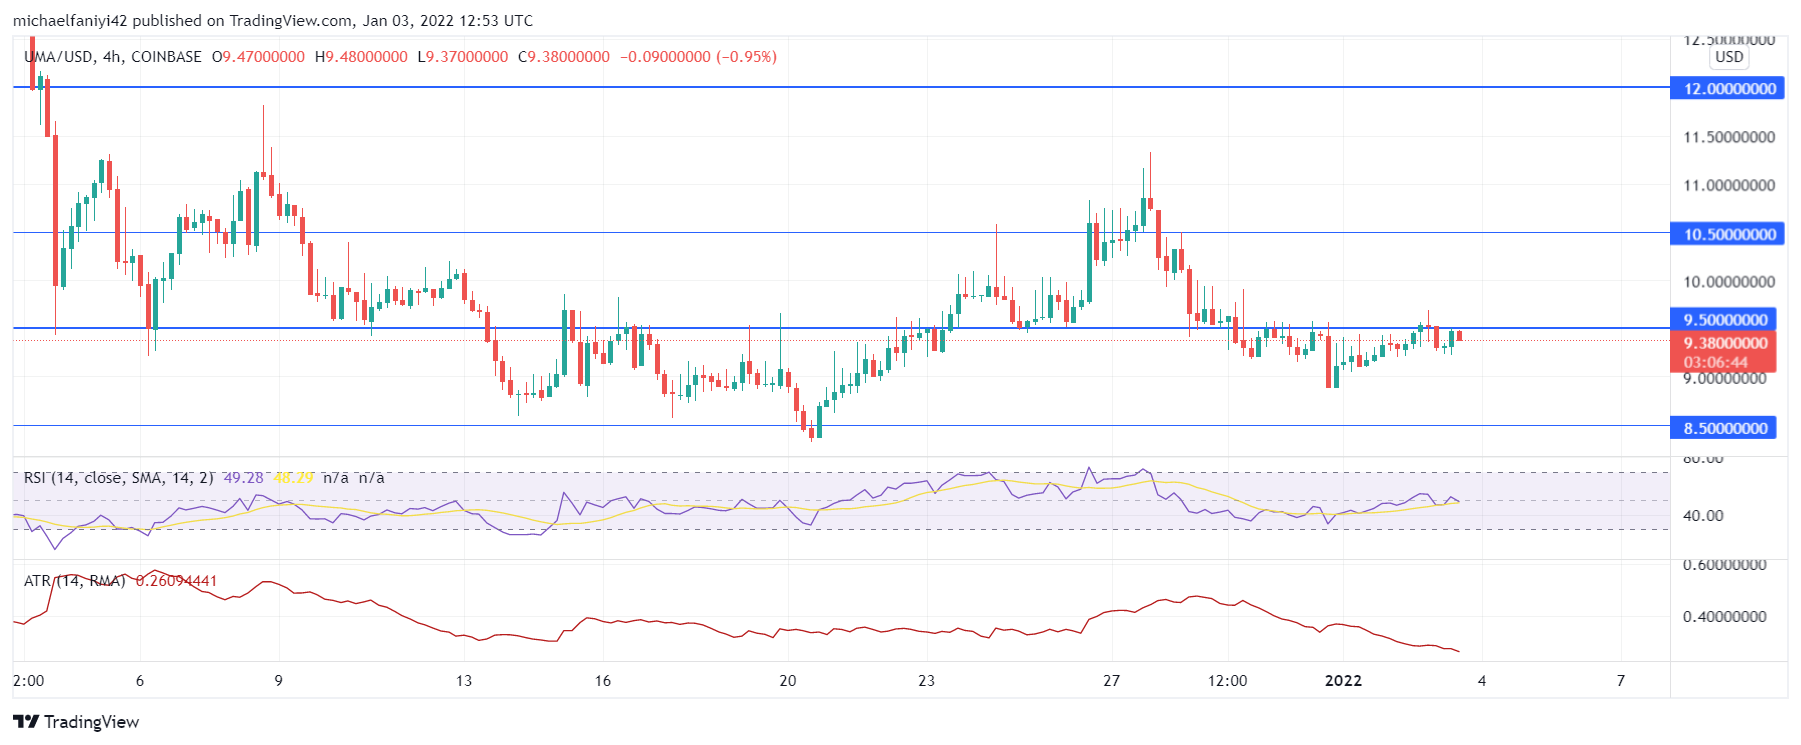
On the 4-hour chart, the market is relatively inactive and shows declining volatility, as seen on the ATR (Average True Range) chart. The RSI chart, with its ascending line, however, maintains that despite relatively low activity in the market, the price remains in an uptrend.
A major barrier to the increase in the market will therefore come at $9.500. If the coin can manage to break that barrier and hold above it, then it will be better positioned to attack the next level at $12.000.
You can purchase crypto coins here: Buy Tokens
Note: Cryptosignals.org is not a financial advisor. Do your research before investing your funds in any financial asset or presented product or event. We are not responsible for your investing results.