Chainlink Gains Ground as Its Bullish Ascent above $6.00 Resumes
Estimated Reading Time: 2 minutes
Don’t invest unless you’re prepared to lose all the money you invest. This is a high-risk investment and you are unlikely to be protected if something goes wrong. Take 2 minutes to learn more
Chainlink (LINK) Long-Term Analysis: Bullish
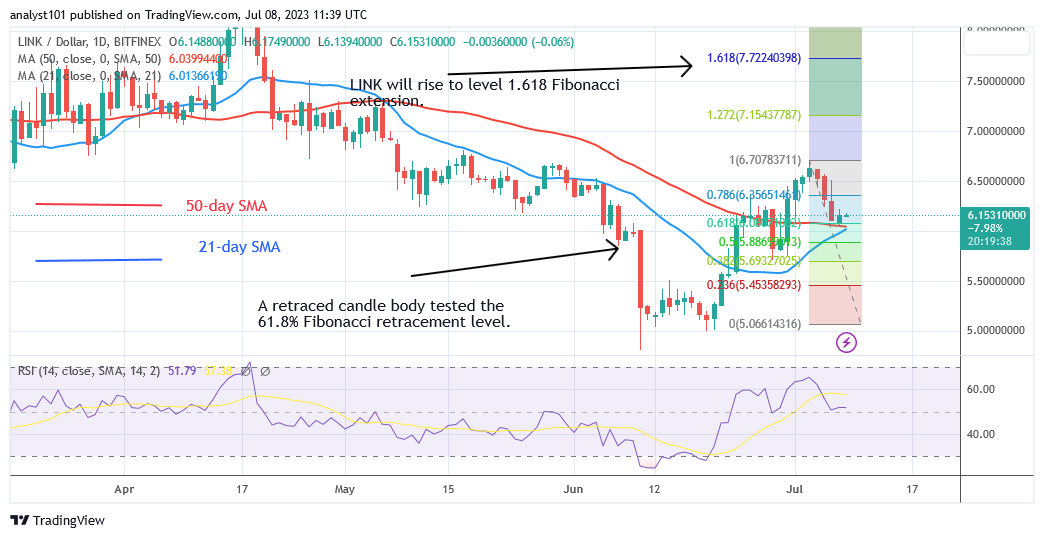
Chainlink (LINK) price has retraced above the moving average lines and remained above it as its bullish ascent above $6.00 resumes. This means that a fresh upsurge is set to commence. At the high of $6.61, the previous rise was resisted. The price of cryptocurrency is creating a series of higher highs and higher lows.
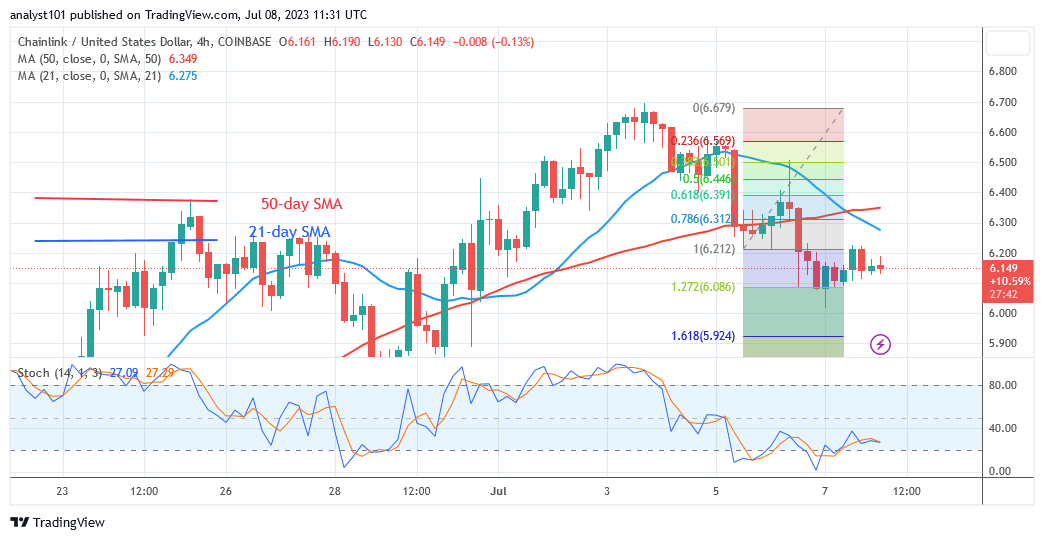
Buyers are gaining ground above the moving average lines. The price indicator has projected that the pair will continue to rise. A retraced candle body tested the 61.8% Fibonacci retracement level on July 2 upswing. The retracement suggests that LINK will increase to the 1.618 Fibonacci extension, or $7.72 level.
Technical indicators:
Major Resistance Levels – $8.00, $10.00, $12.00
Major Support Levels – $6.00, $4.00, $2.00
Chainlink (LINK) Indicator Analysis
Chainlink has retraced above Relative Strength Index level 51 during period 14. The coin’s price has reached equilibrium. This signifies that demand and supply have reached an equilibrium. The currency will rise to previous highs because the bars are currently above the moving average.
The coin has hit bearish exhaustion in a shorter time frame. The bearish momentum has stalled below the daily Stochastic level of 40.
What Is the Next Direction for Chainlink (LINK)?
Chainlink is currently trading above its moving average lines. The altcoin’s ascent is continuing as it remains above the moving average lines. The present upswing will be stopped if the bears break below the moving average lines.
You can purchase crypto coins here. Buy LBLOCK
Note: Cryptosignals.org is not a financial advisor. Do your research before investing your funds in any financial asset or presented product or event. We are not responsible for your investing results