Bitcoin (BTC/USD) Market Ranges Closely Beneath $40,000
Estimated Reading Time: 4 minutes
Don’t invest unless you’re prepared to lose all the money you invest. This is a high-risk investment and you are unlikely to be protected if something goes wrong. Take 2 minutes to learn more

Free Crypto Signals Channel
Bitcoin Price Prediction – March 13
After a loss of upward momentum about a couple of trading days’ sessions in the BTC/USD business activities, the crypto market currently ranges closely beneath the $40,000 resistance line. The trading operations as of the present are featuring between $39,397 and $38,796, keeping a minute positive percentage rate of about 0.76.
BTC/USD Market
Key Levels
Resistance levels: $42,500, $45,000, $47,500
Support levels: $37,500, $35,000, $32,500
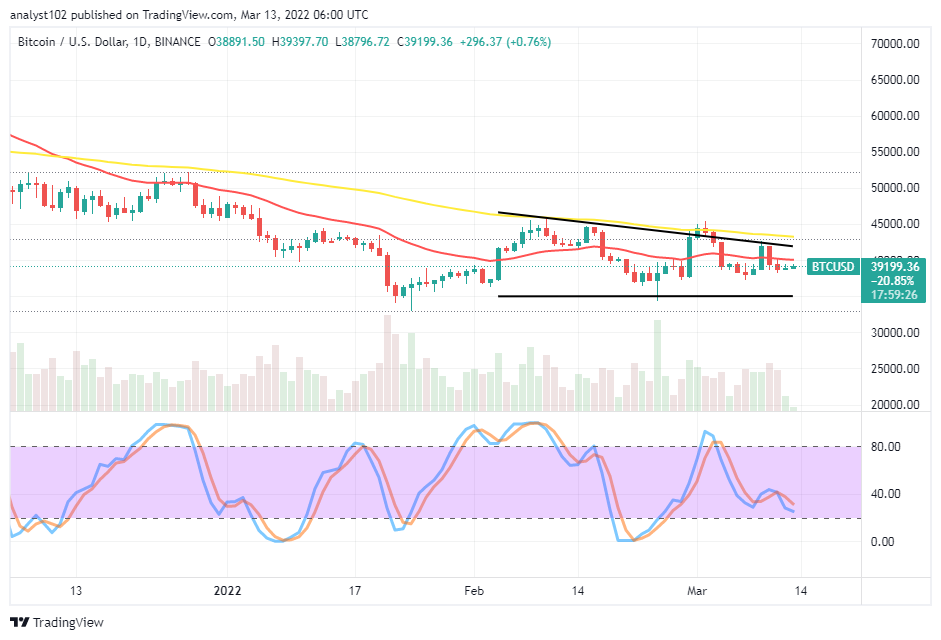
BTC/USD – Daily Chart
The BTC/USD daily chart shows the crypto market ranges closely beneath the $40,000 trading level. There has been a re-occurrence of the instinct of a bearish trading cycle, especially when the price strives to make upward forces to reach higher points above the value-line mentioned. The 50-day SMA indicator is above the 14-day SMA indicator. The bearish trend line slightly drew underneath the bigger indicator to affirm that the crypto trade is under a falling force. The Stochastic Oscillators have crossed southbound within the ranges of 40 and 20, seemingly attempting to move in a consolidation manner. That signifies the market is yet to decide on the next direction away from its present-ranging outlook.
Will the present-ranging outlook prolong the BTC/USD trade operations as the market ranges closely beneath $40,000?
The prolonging of the present-ranging outlook in the BTC/USD trade operations will depend on the two major market movers’ aftermath reactions now that the crypto-economic market ranges closely beneath $40,000. Considering the pattern of the trading situation on the chart, the key trading support levels over time have seen around $35,000. Therefore, long-position placers may have to allow price to come down to find a reliable stance to launch back an upward move before considering a buying order afterward.
On the downside of the technical analysis, the BTC/USD market short-position placers may have a chance to get a re-launch of sell orders around the $40,000 while a fake pull-up has to surface. However, if that presumed analytics doesn’t play out accordingly, previous resistance levels of either $42,500 or $45,000 may revisit. In the process of that assumption materializing, a price reversal motion may exhume to let the market push back down into its bearish trending movement in compliance with what has to be the trend that the market will have to keep for the meantime.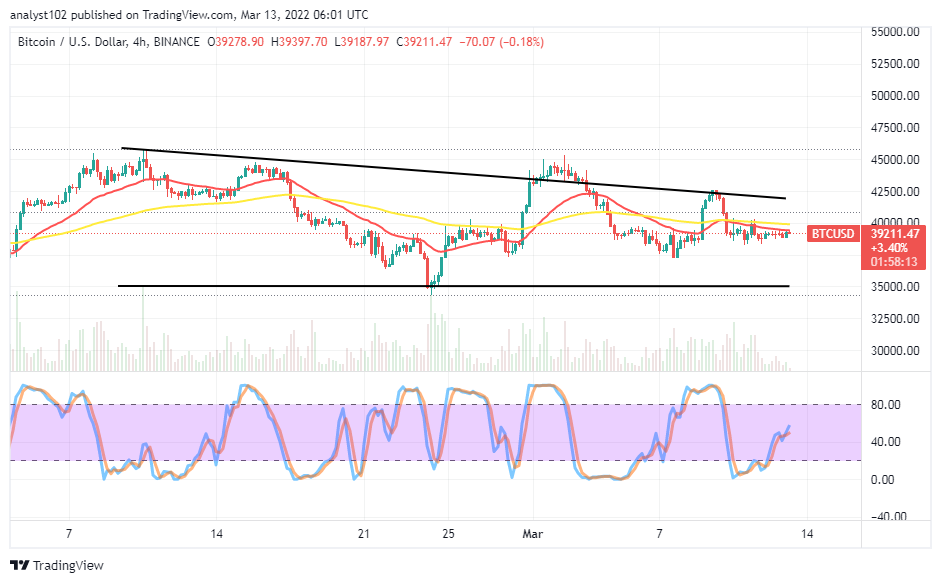
BTC/USD 4-hour Chart
The BTC/USD medium-term chart exhibits the crypto market ranges closely beneath the $40,000 psychological level. The 14-day SMA indicator has from a conjoined point alongside the 50-day SMA indicator turned southbound to position on the line of variant candlesticks been emerging over a couple of times. It again observed that price has to break either northward or southward out of $40,000 and $37,500 to end the current range-bound trading condition. The Stochastic Oscillators are relatively pointing toward the northbound, a bit over the range of 40. It appears indecision is currently playing out in the business deals involving Bitcoin and the US Dollar.
Note: Cryptosignals.org is not a financial advisor. Do your research before investing your funds in any financial asset or presented product or event. We are not responsible for your investing results.
You can purchase Lucky Block here. Buy LBlock: