Hyperliquid (HYPE/USDT) at a Crossroad: The Bears Appear to Be Taking Over
Estimated Reading Time: 3 minutes
Don’t invest unless you’re prepared to lose all the money you invest. This is a high-risk investment and you are unlikely to be protected if something goes wrong. Take 2 minutes to learn more

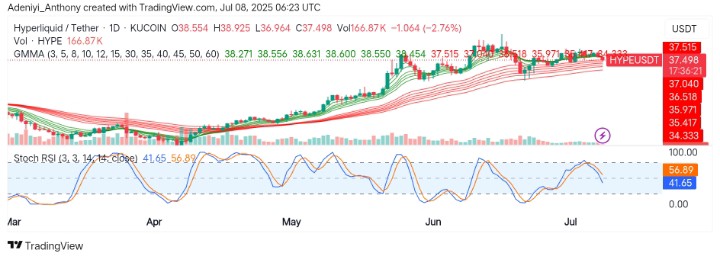
The market for Hyperliquid against Tether appears to be currently showing signs of consolidation with a potential for a continuation or pullback. However, the price has recently encountered resistance around $38.920 and has faced downward pressure, bringing the price closer to the $37.500 range. This could indicate a correction or retracement after a period of bullish momentum from late May to early July. Though the general trend is still bullish, caution is advised, as the price is currently testing key support levels.
To this end, the price action shows the development of a potential corrective phase, where short-term traders might anticipate a pullback toward the support levels.
At the moment, Hyperliquid trades at $37.498, recording over 160K traded volumes for the day.
Technical Indicators
Major Resistance Levels: $37.500, $38.920, and $39.500
Major Support Levels: $35.420, $34.330, and $30.000
Hyperliquid Technical Analysis
The technical analysis of Hyperliquid against the Tether on a daily chart appears to be nearing a crucial decision point, with Guppy Multiple Moving Averages (GMMA) showing that the bullish structure is still intact despite the reduced gap between the sets of EMAs.
On the other hand, the stochastic RSI projects a neutral move, indicating a lack of clear momentum. A crossover below 40 might signal a bearish trend, while a rise above 60 could confirm bullish strength.
To this end, if the price can hold above $38.000, the price may attempt a new bullish rally again; otherwise, a drop below $34.000 might set the stage for a new low.
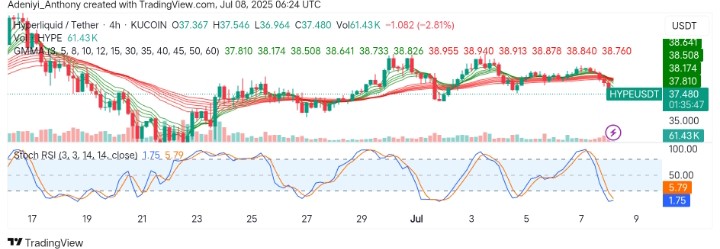
HYPE/USDT Analysis: Pair Faces Key Support Test
The 4H chart for HYPE/USDT shows a clear rejection from the $38.940 resistance zone. However, the price is currently hovering at $37.480, just above the key support band near $37.000 with the compressing GMMA signaling reduced bullish strength and a potential trend shift.
However, the volume spike during the recent dip reflects caution, as the Stochastic RSI has dropped sharply into the oversold territory.
To this end, this downward crossover suggests weakening momentum and a possible further retracement if $36.000 fails.
You can purchase crypto coins here. Buy LBlock