Maker (MKR/USD) Bulls Reassert Dominance Above $2000
Estimated Reading Time: 3 minutes
Don’t invest unless you’re prepared to lose all the money you invest. This is a high-risk investment and you are unlikely to be protected if something goes wrong. Take 2 minutes to learn more
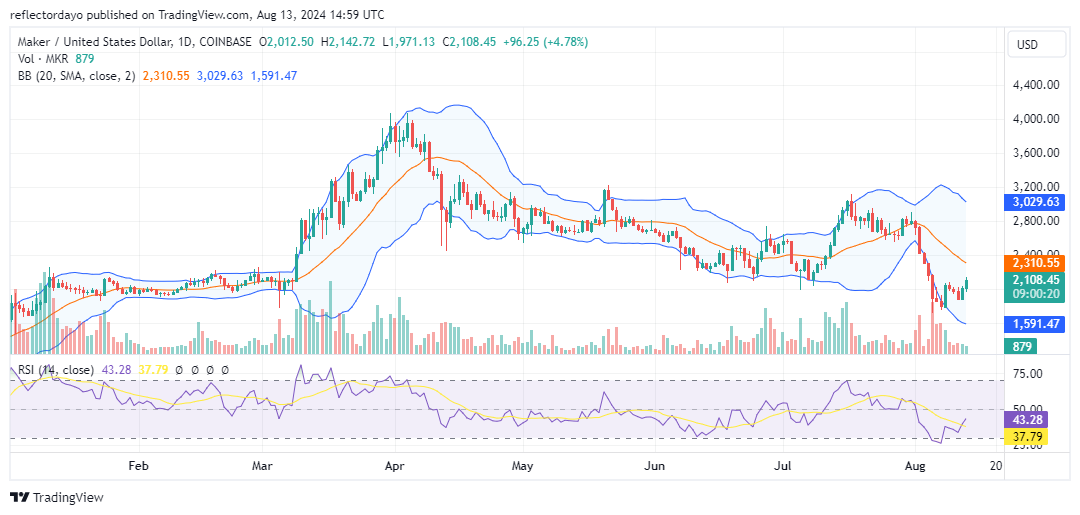
Earlier this year, the Maker market experienced a significant surge, reaching a peak of $4,000 from a previous threshold of $2,000—an impressive 100% gain. Following this rapid ascent, the market underwent a correction, marking the start of a prolonged downward trend. The resistance levels began to decline, indicating increasing bearish pressure, with resistance falling to $3,190 and then further to $3,050. However, more recently, from August 1st to August 7th, the market has shown a sharp and aggressive decline in price.
Maker Market Data
- MKR/USD Price Now: $2,107.99
- MKR/USD Market Cap: $1.9 billion
- MKR/USD Circulating Supply:930,330
- MKR/USD Total Supply:977,631
- MKR/USD CoinMarketCap Ranking: #38
Key Levels
- Resistance: $2,300, $2,400, and $2,500
- Support: $1,600, $1,500, and $1,400.
Maker Market Through the Lens of Indicators
By August 7th, the market had completed a full bullish and bearish cycle, returning to the $2,000 price level from which it initially began its rise. The market now appears to be at a crossroads: it could either break further downward or reverse and pursue higher price levels. Traders have started buying slightly below the $2,000 level, but the price rally has been sluggish, with bears exerting significant pressure around the $2,000 mark. Despite this crypto signal, today’s price action shows that trading is occurring above the $2,000 level, indicating that bulls have gained some control. However, the recovery remains slow as resistance has emerged early in the rally. Additionally, the volume indicator, with its small histogram, suggests that bullish momentum is currently limited.
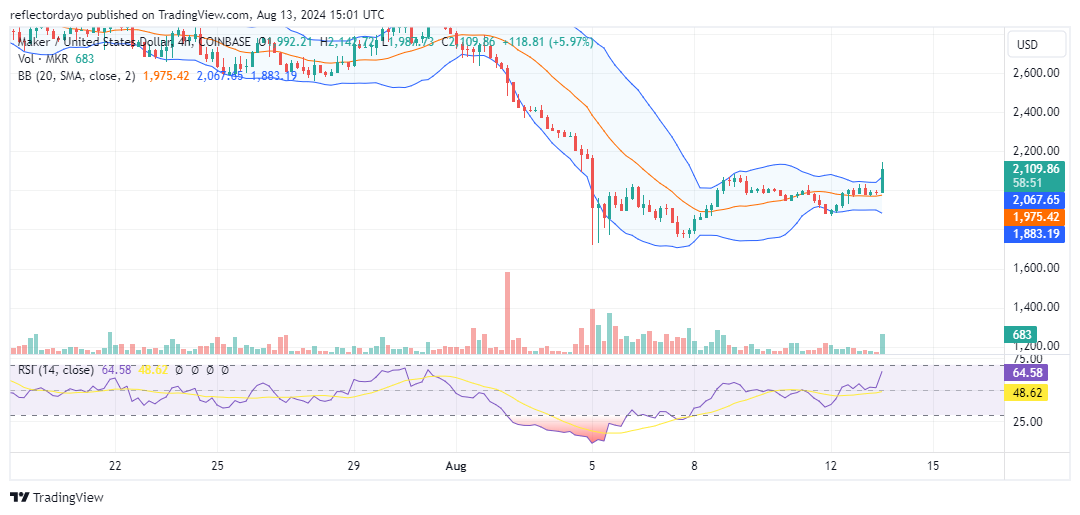
MKR/USD Price Prediction: 4-Hour Chart Analysis
However, analyzing the Maker market from a smaller timeframe, such as the 4-hour chart, presents a more optimistic outlook. The market has broken out of its consolidation phase and is moving toward the next major price level of $2,200. Despite this progress, bearish activity is still evident, as indicated by the upper shadow on the candlestick. Nonetheless, if the market can sustain its current momentum, the bulls could make significant strides in their recovery efforts.