Uniswap (UNI) Price Prediction: UNI/USDT Downward Retracement Continues
Estimated Reading Time: 2 minutes
Don’t invest unless you’re prepared to lose all the money you invest. This is a high-risk investment and you are unlikely to be protected if something goes wrong. Take 2 minutes to learn more

- Date: May 15, 2025
Earlier in the Uniswap daily market, a steep upward retracement was observed, which saw the market breach the $7.00 price level. Although price activity is currently trending downward, it remains above this level. The ongoing retracement does not appear to be particularly strong at the moment.
UNI/USDT Long-Term Trend: Bullish (Daily Chart)
Key Price Levels:
Resistance: $7.50, $8.00, $8.50
Support: $7.00, $6.50, $6.00
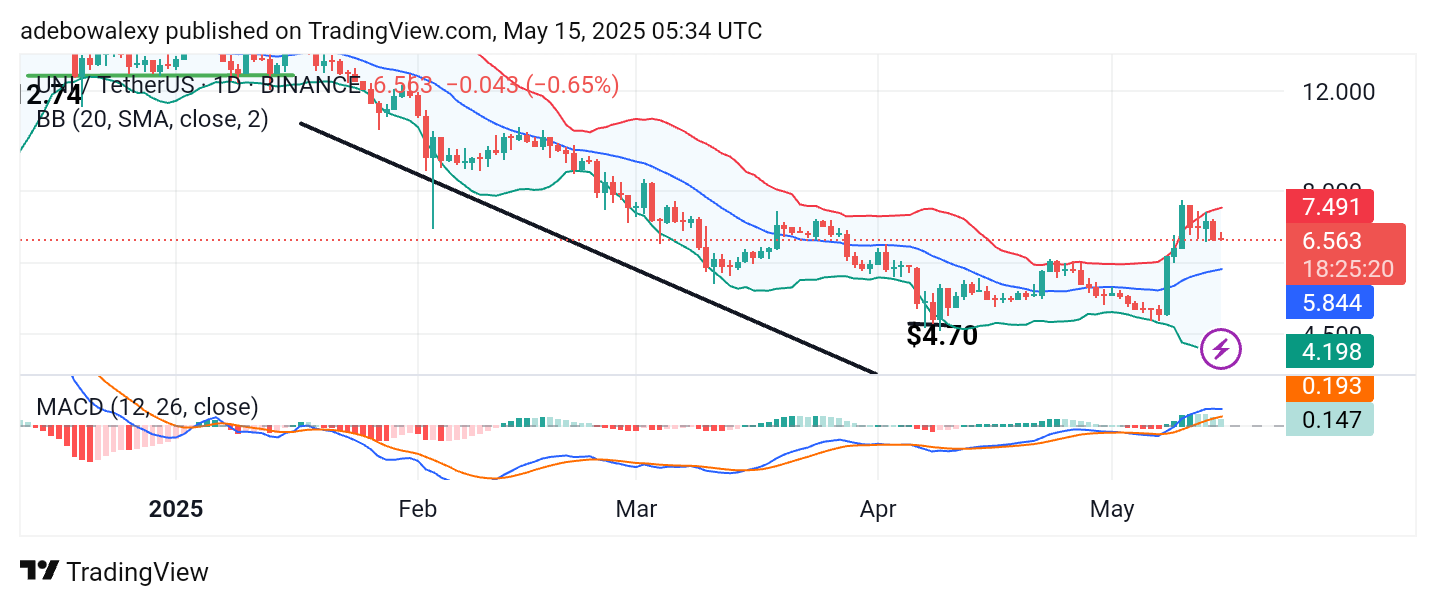
Price activity on the Uniswap daily chart is currently above the $7.00 level. The ongoing session is bearish but represented by a relatively small candle, indicating weak selling pressure. Trading remains above the middle band of the Bollinger Bands indicator. In addition, the Moving Average Convergence Divergence (MACD) lines are still positioned above the equilibrium level. However, their sideways trajectory suggests consolidation due to the moderate pullback on the daily chart.
Uniswap (UNI) Price Prediction: UNI/USDT Hovers Above $6.50
Looking at the Uniswap daily chart, it is evident that the price is encountering resistance near the $8.00 mark. As a result, it has gradually retraced toward the $6.50 level. Despite this, price activity remains above the midline of the Bollinger Bands.
Similarly, the movement of the MACD indicator suggests that bearish pressure is present but not particularly strong. The MACD lines are slightly sideways, and the histogram bars have turned pale green, signaling a slowdown in bullish momentum.
Uniswap (UNI) Price Prediction: UNI/USDT Finds Support Above $6.50
Recently, the Uniswap market has been relatively quiet on the 4-hour chart. This is evident in the smaller candlesticks forming during recent sessions, indicating reduced volatility. The market appears to be consolidating just above the lower band of the Bollinger Bands.
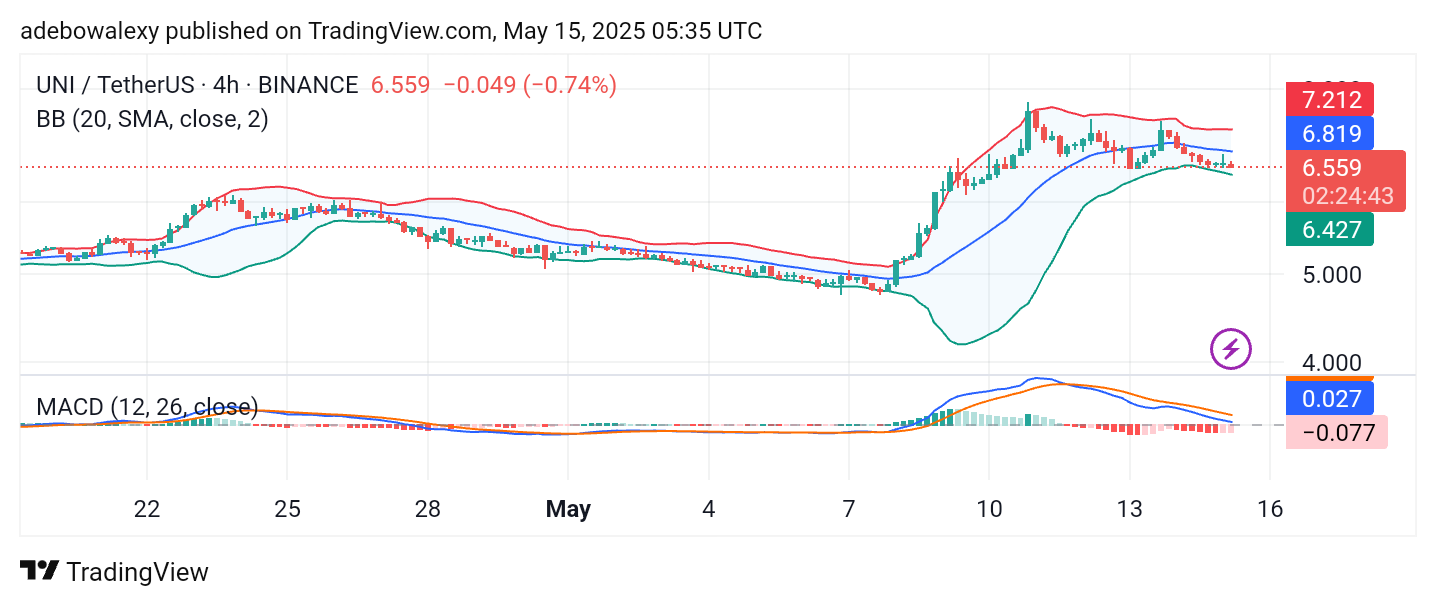
The MACD lines have been descending toward the equilibrium level over the past few sessions. However, the most recent MACD bar has turned pale red, suggesting that bearish momentum is weakening. Consequently, there may be a potential upward rebound toward the $7.00 price level.