Zcash (ZEC/USD) at a Crossroads: Consolidation or Decline?
Estimated Reading Time: 2 minutes
Don’t invest unless you’re prepared to lose all the money you invest. This is a high-risk investment and you are unlikely to be protected if something goes wrong. Take 2 minutes to learn more

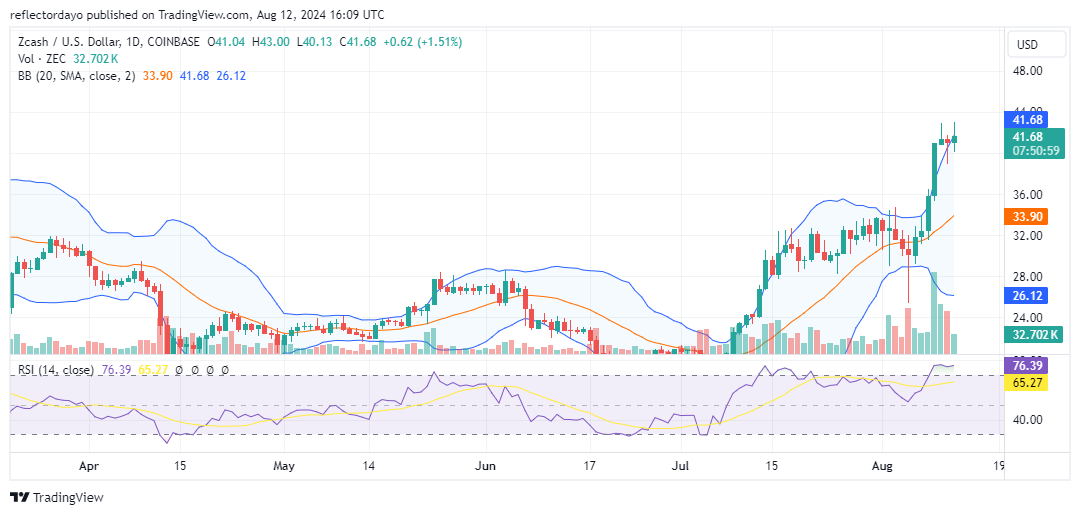
Zcash’s remarkable performance between last month and this month has sparked substantial investor interest. Investors have shown increased willingness to buy even after the bullish price broke through the resistance at $33.67. This bullish momentum drove the price above the significant $40 level. After reaching this milestone, price action stabilized above $40. Although bullish momentum may be waning at the moment, the bulls are striving to maintain stability above this key price level.
Zcash Market Data
- ZEC/USD Price Now: $42.06
- ZEC/USD Market Cap: $682 million
- ZEC/USD Circulating Supply: 16.3 million
- ZEC/USD Total Supply: 16.3 million
- ZEC/USD CoinMarketCap Ranking: #82
Key Levels
- Resistance: $44.00, $45.00, and $50
- Support: $30.00, $25.00, and $20.00.
Zcash Market Through the Lens of Indicators
The performance of the Zcash market over the past few months has been exciting for bullish traders, with the market clearly in a bullish phase. However, as trading volume declines and momentum slows, the market may be approaching a period of consolidation or a potential trend reversal. Additionally, the RSI is hovering above the 70 level, indicating an overbought condition, which may be contributing to the market’s deceleration. Despite this crypto signal, it is impressive that the market has maintained a strong position above the $40 level. The candlestick representing today’s trading activity is a spinning top, characterized by substantial upper and lower shadows. This suggests significant pressure from both sides of the market, which could eventually lead to a consolidation phase.
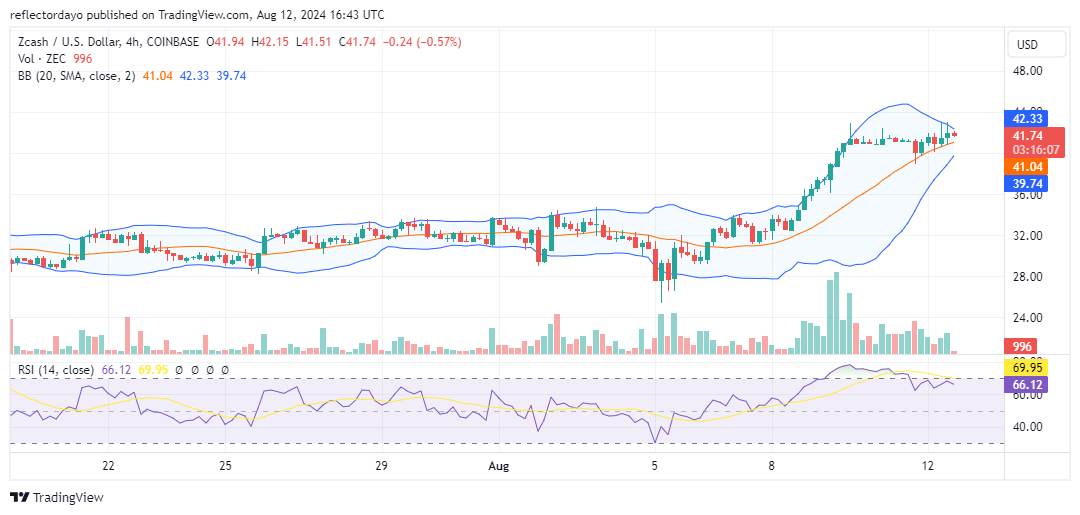
ZEC/USD Price Prediction: 4-Hour Chart Analysis
From a smaller timeframe perspective, the market has been ranging sideways for some time. Recently, however, volatility has increased, while the Bollinger Bands are converging. This convergence suggests that a strong price movement is imminent. The movement may likely be to the upside, as the price action is currently above the 20-day moving average. However, to confirm this anticipated bullish signal, the price must first break above the $42 level.