Solana (SOL/USD) Market Buyers Push for a Peak Point
Estimated Reading Time: 3 minutes
Don’t invest unless you’re prepared to lose all the money you invest. This is a high-risk investment and you are unlikely to be protected if something goes wrong. Take 2 minutes to learn more
Solana Price Prediction – March 17
A rejigging session of mustering energy has surfaced in the SOL/USD price valuation as the crypto market buyers push for a peak point under a quick-fetched overbought condition. As of this technical piece compiling, the price maintains trading zones hiked and decreased between $20.74 and $19.47 at an average percentage rate of 4.56 positives. A thin layer of resistance has built up around $22.50.
SOL/USD Market
Key Levels:
Resistance levels: $25, $27.50, $30
Support levels: $15, $12.50, $10
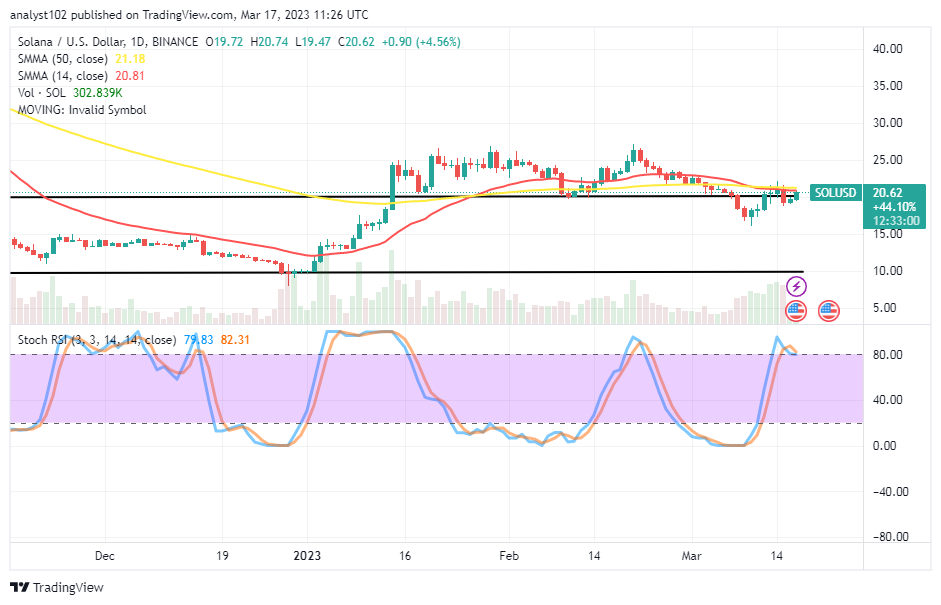
SOL/USD – Daily Chart
The SOL/USD daily chart showcases the crypto-economic market long-position placers push for a peak point; in an attempt to breach northward beyond the SMA trend lines. The 14-day SMA indicator is at a $20.81 value line around the $21.18 value of the 50-day SMA indicator. That indicates that the price needs to fearfully break through the indicators devoid of any quick reversal signs. The Stochastic Oscillators are in the overbought region, seemingly trying to cross their lines southbound at 82.31 and 79.83 levels.
Will the SOL/USD trade bulls hold firmly in the face of any loss of momentum bid around the SMAs?
The primary trading venue, however, does not necessarily indicate the ideal timing to launch buying position orders. Bulls must halt any new orders for yearning. To ensure the long sustenance of increases in the SOL/USD trade valuation, long-position takers have to hold their presence firmly around the trend lines of the SMAs, as it has been that buyers have been pushing for a peak point.
On the downside of the technical analysis, northward motions from the trading indicators may have to allow to play out maximally to about two to three smaller bearish candlesticks before placing a shorting order afterward. The resistance trading line against the present uprises is around $25, even if the market has to run a long-rallying movement. An early reversal of a breakout around the SMA points will mean a decent instant shorting entry.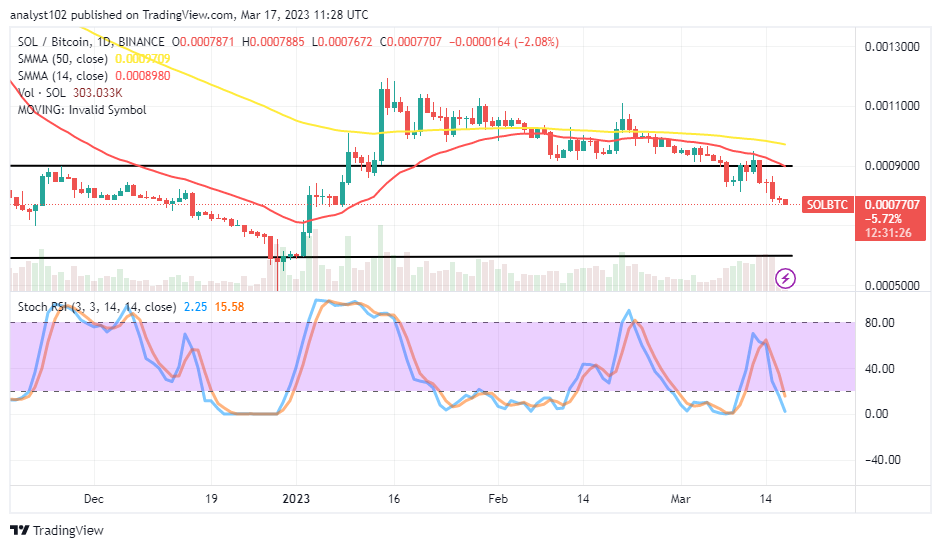
SOL/BTC Price Analysis
In comparison, Solana is still giving in to a positive response to depression caused in the market by the purchasing weight of Bitcoin. Indicating that some falling forces are still at work in the range-bound zones shown on the chart, the 14-day SMA indicator has shifted marginally southward beneath the 50-day SMA indicator. The Stochastic Oscillators have crossed southbound to the points between 15.58 and 2.25 in the oversold region. At this time, the base crypto needs to strive by producing a bullish candlestick capable of making the Stochastics cross its blue line against the red line to the upside to regain the trait of swinging back high.
Note: Cryptosignals.org is not a financial advisor. Do your research before investing your funds in any financial asset or presented product or event. We are not responsible for your investing results.
You can purchase Lucky Block here. Buy LBLOCK