Solana (SOL/USD) Market Debases Past $20
Estimated Reading Time: 3 minutes
Don’t invest unless you’re prepared to lose all the money you invest. This is a high-risk investment and you are unlikely to be protected if something goes wrong. Take 2 minutes to learn more
Solana Price Prediction – March 10
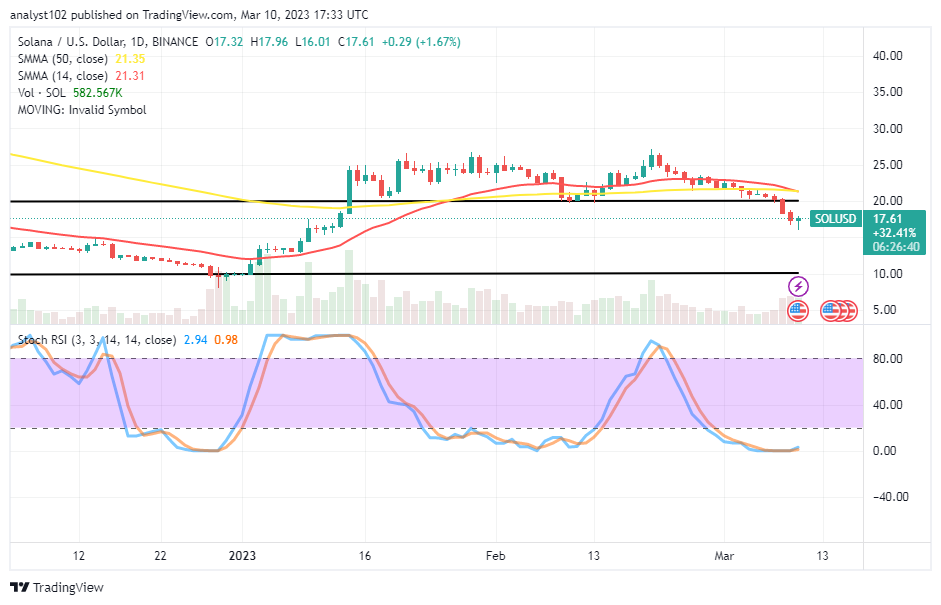
In the last operations, the SOL/USD trade long-position takers were to push back northward around the $20 line. Instead of that assumption, the crypto market debases past the psychological trading line to average a lower point of $15. The sharp declining force has given birth to high and low-value lines of $17.96 and $16.01 at an average positive 1.67 percent. As of this technical write-up, the price is to make for some rebounds.
SOL/USD Market
Key Levels:
Resistance levels: $22.50, $25, $27.50
Support levels: $15, $12.50, $10
SOL/USD – Daily Chart
The SOL/USD daily chart reveals that the crypto-economic market debases past the $20 trading level in the last bargaining session. The 14-day SMA indicator has minutely strived for an interception of the 50-day SMA indicator to the downside at points of $21.35 and $21.31. At the previously mentioned location, the upper horizontal line drew. The Stochastic Oscillators are in the oversold area, retaining the levels of 0.98 and 2.94, moving in the south at a slow speed.
Will there be additional southward position changes in the SOL/USD trade activities beyond the $15?
There may be more lows beyond the $15 support level in the SOL/USD trade activities if the 14-day SMA trend line smoothly intercepts the 50-day SMA indicator to the downside, as it has been that the crypto market debases past the $20 level sharply during the recent financial transaction record. Today’s trading candlestick’s shadow tail end has to be instrumental in an early baseline to derive upswing tasks. A fearful reversal-moving mode against it will summarily lead to a revisit of a lower point between $12.50 and $10 in the long run.
As the Stochastic Oscillators indicate that the SOL/USD market bears are trading in an oversold area, the technical analysis’s downside suggests they should consolidate their position beneath the $20 upper range line. Position entrance has been challenging since the forces on the south side can show up unexpectedly.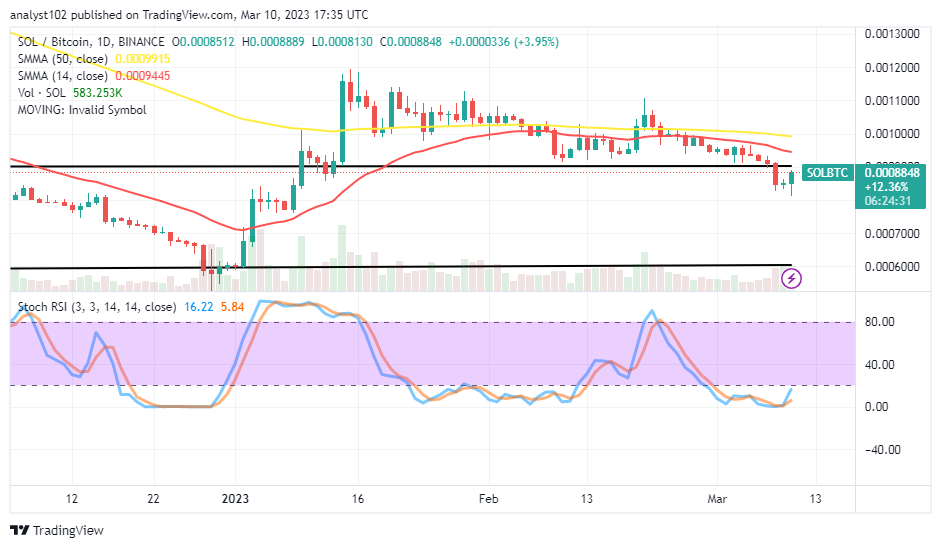
SOL/BTC Price Analysis
In comparison, Solana currently appears to build a catalyst against the trending force of Bitcoin beneath the upper horizontal line drew c; loosely beneath the SMA trend lines. The 14-day SMA indicator has over time underneath the 50-day SMA indicator. And it is presently crossing southward over the upper range point. The Stochastic Oscillators are in the oversold region, trying to move northbound, maintaining 5.84 and 16.22 levels. It shows that the base cryptocurrency is trying to regain some lost momentum.
Note: Cryptosignals.org is not a financial advisor. Do your research before investing your funds in any financial asset or presented product or event. We are not responsible for your investing results.
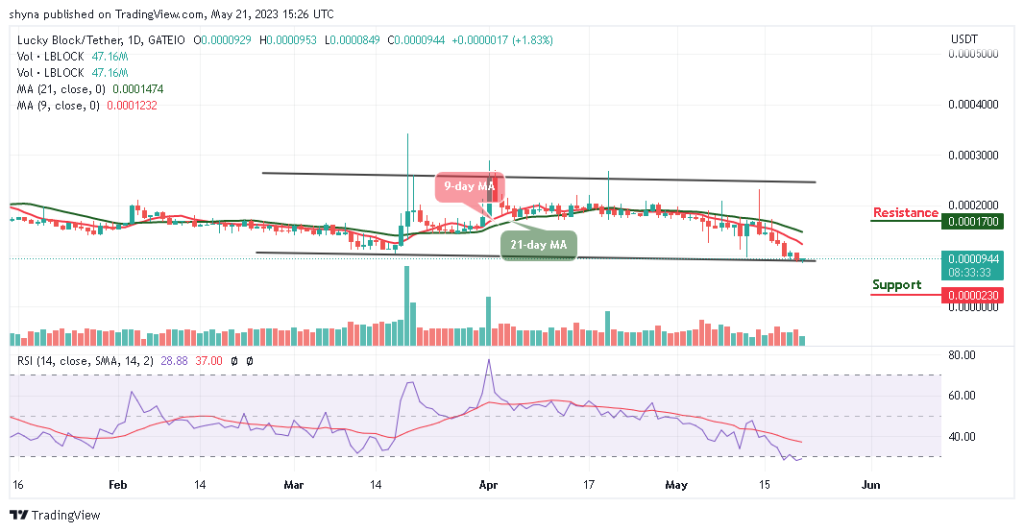
You can purchase Lucky Block here. Buy LBLOCK