Bancor (BNTUSD) Remains Under Bearish Pressure
Estimated Reading Time: 3 minutes
Don’t invest unless you’re prepared to lose all the money you invest. This is a high-risk investment and you are unlikely to be protected if something goes wrong. Take 2 minutes to learn more
Bancor Market Analysis – BNTUSD Remains Under Pressure by the Bears
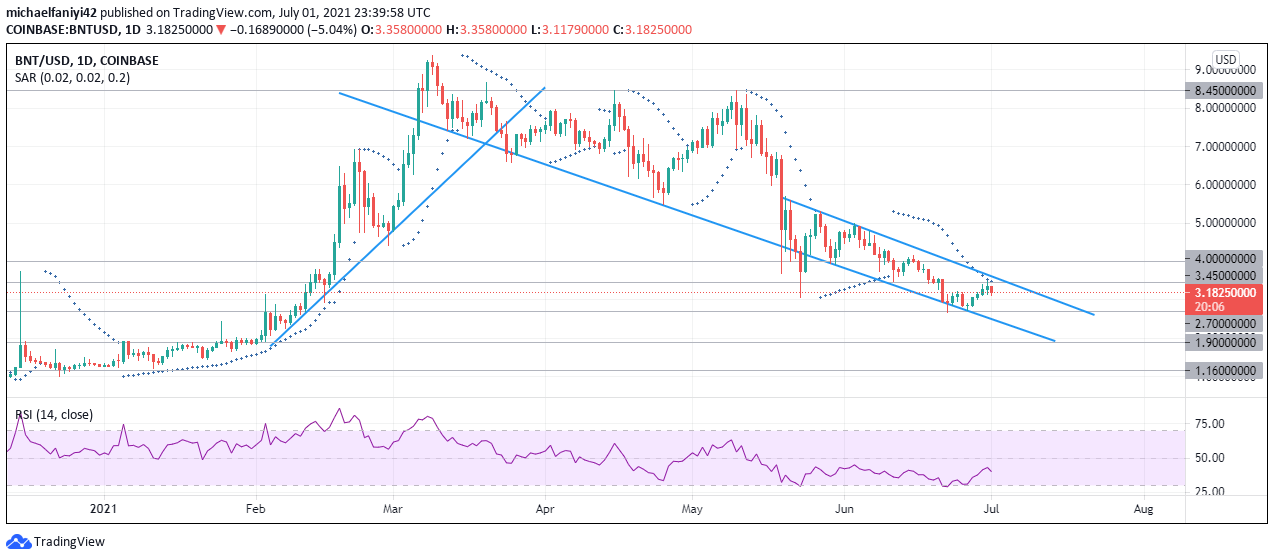
As BNTUSD remains under bearish pressure, the market settled into a range. By the beginning of the year, Bancor was battling to move above the $1.900 supply level. This was eventually achieved, albeit gradually, by the 1st of February 2020.
On the 3rd of February, the bulls took charge of the market and started forcing the market upwards. The bears applied pressure, and the market experienced a significant pullback that lasted from the 19th to the last day of February. The coin, however, recovered and sprang up from an ascending trend line to reach the year’s high at $9.400.
Subsequently, the bulls ceded power to the bears, who began engineering a downward movement. At several intervals, the bulls tried to make a comeback, but the price was well defended at the $8.450 supply line. Finally, the market stopped its persistence and just slid along with the bearish pressure into a channel. In the channel, BNTUSD has been zigzagging from the lower border to the higher border.
The market is currently being held back by a supply level of $3.450, which is preventing it from crossing the upper boundary of the channel. This was also the situation with the previous high, which then went ahead to touch the lower border. The Parabolic SAR (Stop and Reverse) indicates that the general trend remains bearish.
The RSI (Relative Strength Index) shows that the market has generally been trading in the lower half of its scale, which gives much credence to the fact that the market is under bearish pressure. Its signal line had just recovered from a drop when it began to fall again.
BNTUSD Key Zones
Supply Zones: $8.450, $4.000, $3.450
Demand Zones: $2.700, $1.900, $1.160

What Is Next For Bancor?

The price has bounced off $3.450 to go lower. This is still following its zigzagging movement along the channel. The coin is now expected to also go lower, towards $2,700, and then to the lower border of the channel. Stronger bearish pressure will be required to push prices out of the channel and into the next demand zone at $1.900. The Parabolic SAR indicator, as well as the RSI, confirm a continuous market move downwards.
You can purchase crypto coins here. Buy Tokens
Note: Cryptosignal.org is not a financial advisor. Do your research before investing your funds in any financial asset or presented product or event. We are not responsible for your investing results.