Polygon (MATIC/USD) Price Rises, Retarding Negativities
Estimated Reading Time: 3 minutes
Don’t invest unless you’re prepared to lose all the money you invest. This is a high-risk investment and you are unlikely to be protected if something goes wrong. Take 2 minutes to learn more
Polygon Price Prediction – February 19
Muscling of momentum process has been firmly executed by bulls in the bargaining line that involves Polygon and the US Dollar, as the present trade situation is having that the market swings high, retarding negativity inputs.
There has been a steady outpouring of gravitational price changes without a discernible signal to shorting events. Because the price has been riding on a consolidation pattern to the upside, buyers should also be cautious if they perceive a tendency for the price to make a reversal of the mooning motion at any point in time. It has been noted that buyers do not necessarily need to let a downward shift movement to break past the underlying backup trading line of $0.90 in order to break past it further over time.
MATIC/USD Market
Key Levels:
Resistance levels: $1.10, $1.20, $1.30
Support levels: $0.90, $0.85, $80
MATIC/USD – Daily Chart
The MATIC/USD daily chart shows that the crypto-economic market swings high, retarding negativity movements index.
The Bollinger Band trend lines have the upper side stretching systemically on course to the north with a line formation of bullish candlesticks. The stochastic oscillators have been in the overbought region, moving in a consolidation style to indicate that buying pressures are still taking the lead of the cycle.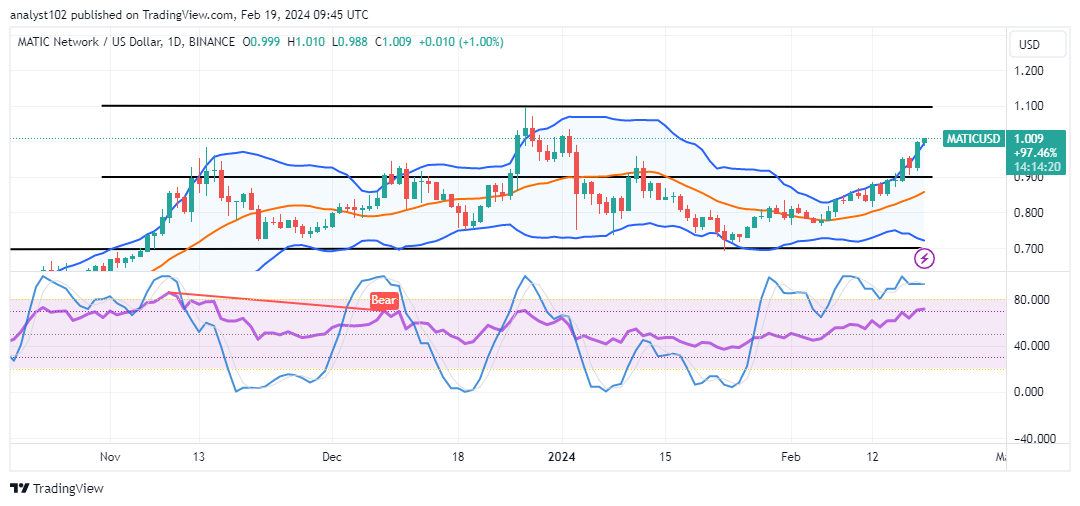
At what point in time does the MATIC/USD market tend to return to a correctional mode as the price pushes averagely toward the line of $1.10?
A change against the current market’s reactions will be probable coming to pass the moment that there are two to three candlesticks carrying bearish signs at higher resistances as the MATIC/USD trade swings high, retarding negativity signs.
In the wake of the present uprising pathway, traders who intend to commit their funds on a long-term basis might embark on the crypto signal that is supporting further barriers to broken by bulls will be obtained In the market extends its potential for reversals against the middle Bollinger Band, it would be the worst-case scenario against the current advances.
There is now no compelling rationale for sellers to initiate an immediate shorting position order based on the trade signal and price movement style. Based on that sentiment , it would make psychological sense for short-position takers to wait to begin selling until a visual line of rejections is visible.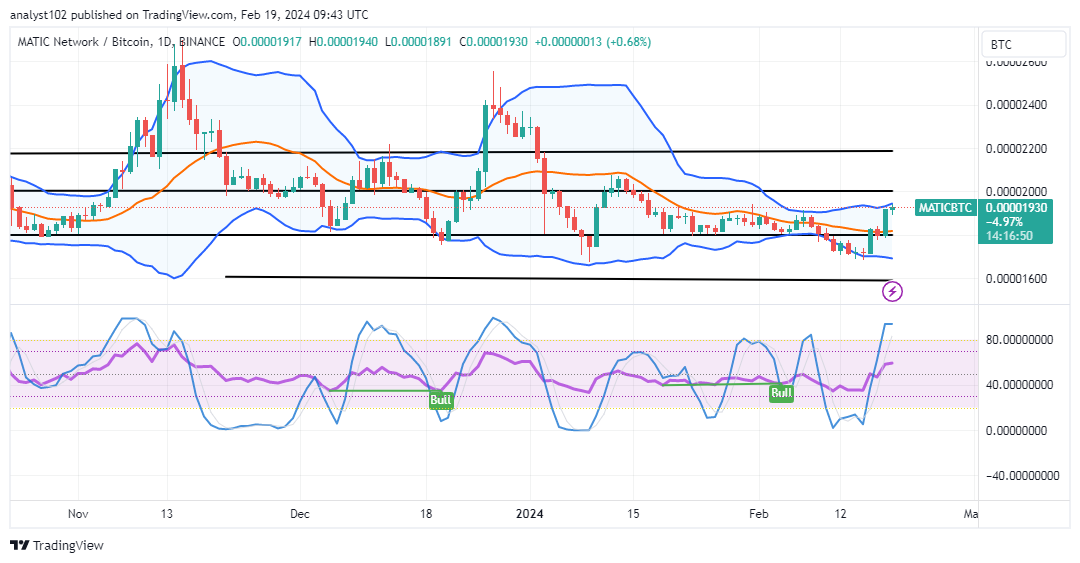
MATIC/BTC Price Analysis
In comparison, the Polygon market swings high against the purchasing power of Bitcoin, retarding negative signs around the upper Bollinger Band. I
Indicators have gradually dropped to significant reduction zones, where it is anticipated that the base cryptocurrency will fend off numerous attempts by counter-crypto instrumentation in the near future. There may yet be space for more rising moments as the stochastic oscillators have crossed into the overbought area to the north.
Note: Cryptosignals.org is not a financial advisor. Do your research before investing your funds in any financial asset or presented product or event. We are not responsible for your investing results.
You can purchase Lucky Block here. Buy LBLOCK