Solana (SOL/USD) Price Hovers in $20 and $10
Estimated Reading Time: 3 minutes
Don’t invest unless you’re prepared to lose all the money you invest. This is a high-risk investment and you are unlikely to be protected if something goes wrong. Take 2 minutes to learn more
Solana Price Prediction – November 27
The SOL/USD market movements have been sideways over several days of operations as the crypto’s price hovers in the $20 and $10 trading points. Price is keeping a minute positive 0.85% at an average percentage rate of $14.28.
SOL/USD Market
Key Levels:
Resistance levels: $20, $25, $30
Support levels: $10, $7.50, $5
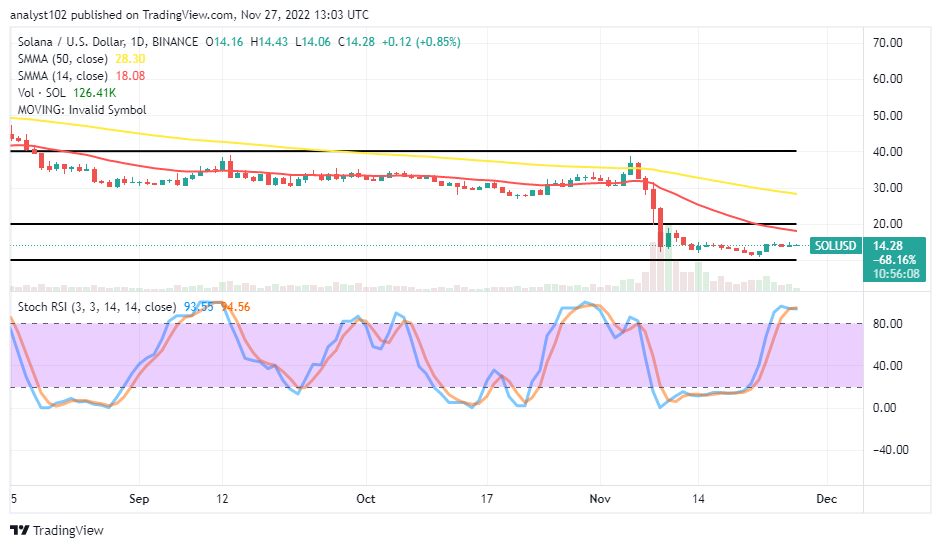
SOL/USD – Daily Chart
The SOL/USD daily chart reveals the crypto-economic price hovers in the $20 and $10 trading levels. Some days back, the upper and the lower horizontal lines have been to mark those values and to ascertain the psychological direction the market may tend to push after a while. The 14-day SMA indicator is at $18.08, underneath the $28.30 value line of the 50-day SMA indicator. The Stochastic Oscillators are in the overbought region, maintaining 94.56 and 93.55 levels to indicate the possibility o the price experiencing a pit stop at the current trading capacity.
What is the current gravity force outlook for SOL/USD market operations?
Going by the reading of the Stochastic Oscillators, it appears that the SOL/USD market operations may soon begin to downsize in its gravitational force to the upside direction as the crypto’s price hovers in the $20 and $10 trading zones. Buyers should take volatility into account, given its signal support, when the Stochastics tool implies that the price is around or inside low levels before executing a long order afterward, even when the market is still at one of its lowest points.
On the downside of the technical analysis, sellers may dwell on the left-over declining pressures that can cause rejections around the value of the 14-day SMA indicator, coupling the resistance point around the $20 level. However, bears may run into a difficult situation should a sudden breakout occur against the upper horizontal line. Hence the need to apply proper money management.
SOL/BTC Price Analysis
In comparison, Solana appears not to have garnered a much-needed catalyst to shoot up against the trending outlook of Bitcoin over some days ago. The pairing crypto’s price hovers in definite range-bound spots underneath the trend lines of the SMAs. The 14-day SMA indicator is below the 50-day SMA indicator. The Stochastic Oscillators are in the overbought region at 94.78 and 93.98 levels. That suggests the base crypto has not gotten a firmer stance to push forcefully against its counter-trading crypto in the near transaction dealings. SOL will still have to make a necessary correction before getting an uptrend motion.
Note: Cryptosignals.org is not a financial advisor. Do your research before investing your funds in any financial asset or presented product or event. We are not responsible for your investing results.
You can purchase Lucky Block here. Buy LBLOCK