Solana (SOL/USD) Price Retracement May Continue to $20
Estimated Reading Time: 3 minutes
Don’t invest unless you’re prepared to lose all the money you invest. This is a high-risk investment and you are unlikely to be protected if something goes wrong. Take 2 minutes to learn more
Solana Price Prediction – March 2
It observed that activities characterizing buying and selling in the SOL/USD market operations have consistently been featured in a range-bound mode as the crypto-economic price retracement, tending to continue to the $20 trading line. Price has been trading around the $21.85 market line, keeping a negative percentage rate of 3.02. It shows sellers are somewhat prevailing over the buyers’ weakness as of the time of this technical piece.
SOL/USD Market
Key Levels:
Resistance levels: $25, $27.50, $30
Support levels: $17.50, $15, $12.50
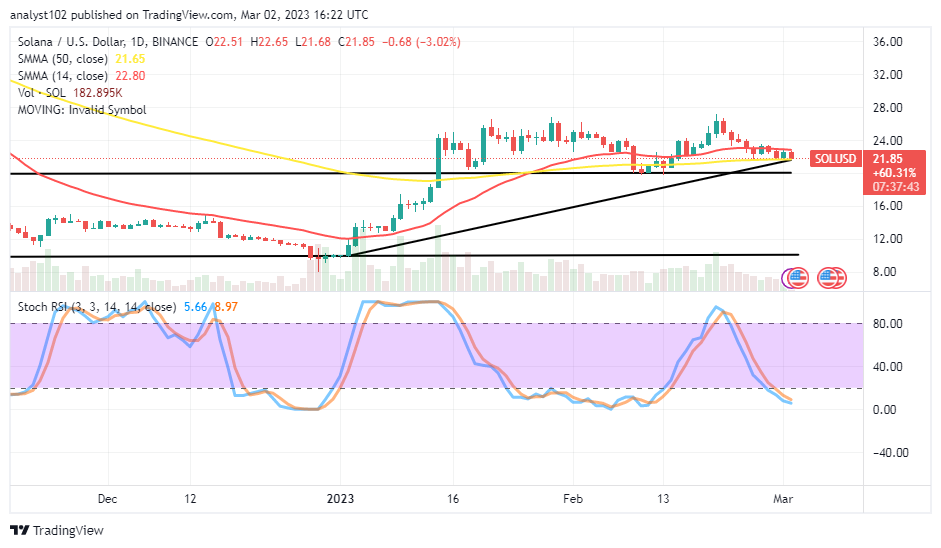
SOL/USD – Daily Chart
The SOL/USD daily chart reveals that the crypto-economic price retracement may continue to the $20 upper range line. The 14-day SMA indicator is at the $22.80 value line above the $21.65 point of the 50-day SMA indicator. The Stochastic Oscillators have remained southbound, positioning in the oversold region at 8.97 and 5.66 levels. With the formation of a bearish trading candlestick, aiming to breach the bigger SMA to the lower side, the US currency will remain a bit pressing harder toward achieving some lows afterward.
What is the declining gravitational force currently like in the SOL/USD trade activities?
It has been relative that the SOL/USD trade activities have been in the position as price retracement may continue to the $20 level. The upper range line and the SMA values should attract buyers’ strategic trading approach. A sudden aggressive breakdown of the point earlier mentioned will amount to the negation of getting longing entry orders, especially if the market fails to rebound quickly in no time.
On the downside of the technical analysis, bears would have to hold their presence in the market firmly underneath the 14-day SMA trend line’s value. Nevertheless, it is riskier for bears to play alongside the moves at this point to the south side as a rebounding motion may be forthcoming unprecedented, especially if the price intends to only go down for a test of around the upper range line at $20.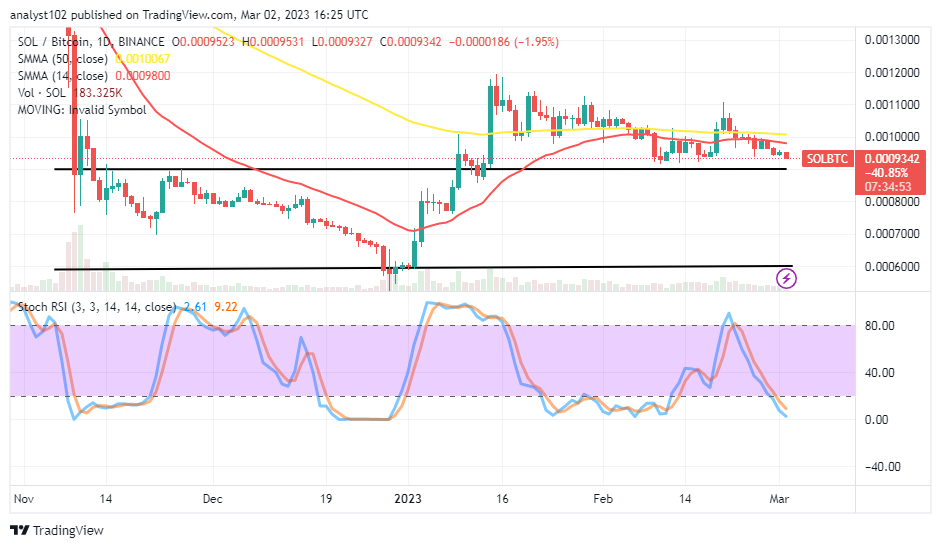
SOL/BTC Price Analysis
In comparison, Solana has been losing trending pace to Bitcoin across the SMA trend lines to the south side. The 14-day indicator is underneath the 50-day SMA indicator. The Stochastic Oscillators have traversed southbound from the 80 range line into the oversold region to keep at 9.22 and 2.61 levels. The occurrence of bearish candlesticks toward the upper range line has shown the base crypto is approaching capacity exhaustion. Based on that, buyers need to be alert and take advantage of an uprise as to when it will be.
Note: Cryptosignals.org is not a financial advisor. Do your research before investing your funds in any financial asset or presented product or event. We are not responsible for your investing results.
You can purchase Lucky Block here. Buy LBLOCK