Band Protocol (BANDUSD) Buyers Are Preparing for a Swift Recovery
Estimated Reading Time: 2 minutes
Don’t invest unless you’re prepared to lose all the money you invest. This is a high-risk investment and you are unlikely to be protected if something goes wrong. Take 2 minutes to learn more

Free Crypto Signals Channel
BANDUSD Analysis – Band Protocol Buyers Are Preparing for a Swift Recovery From the Bearish Trend
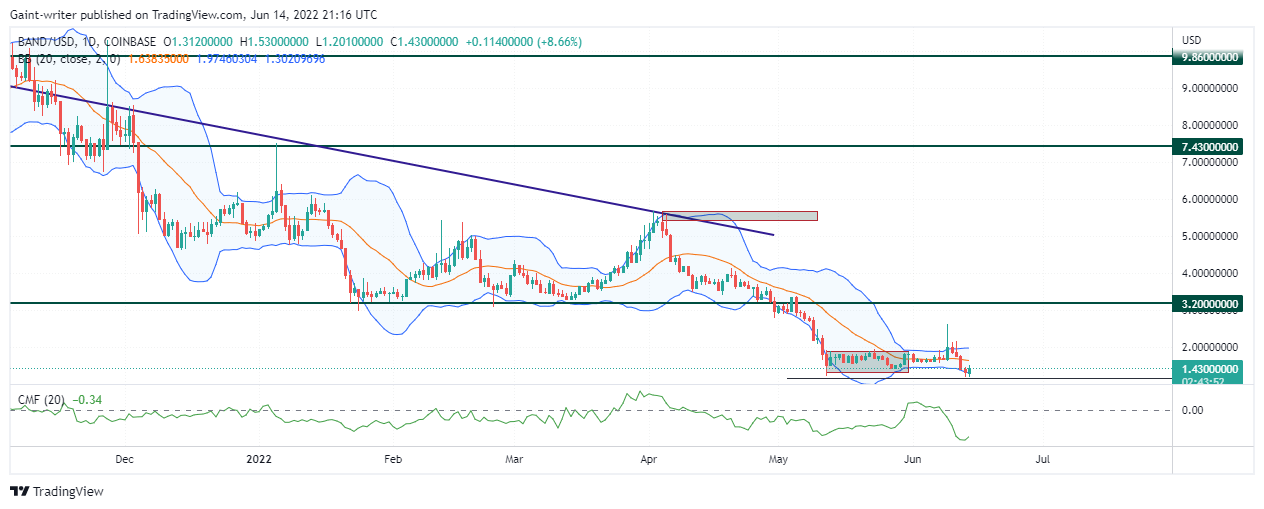
Band Protocol buyers are preparing for a swift recovery from the bearish trend. The BAND value has diminished to $1.1600 in the key zone due to sellers’ pulling strings on its value. The BANDUSD structure had appeared quiet for a few months, resulting in the prospect of unwillingness to value price orders. The structure of the BAND Protocol seems to be building up until we see a short-selling signal to the key zone at $1.1600.
BANDUSD Critical Levels
Resistance Levels: $9.860, $7.430
Support Levels: $3.200, $1.1600
The price roll from the $9.800 key zone gave the crypto market room for bearish adoption. Ever since then, the buy traders have been a little handicapped. The token of the Band Protocol continues to decline as more bearish orders are exposed. Shortly after a break beyond the $7.400 key level, the retail traders continued to sell short till the price arrived at the $3.200 critical level.
The current state of the Band Protocol says that the price is reacting near $1.1600 following an accumulation in its value for a while. The Bollinger Band indicator confirmed a price squeeze before arriving at the $1.1600 key zone. The buyers are now appearing in the price structure, hoping to change the price tendency. The Money Flow index indicator is rising despite still being in a sell region.

BANDUSD Expectations
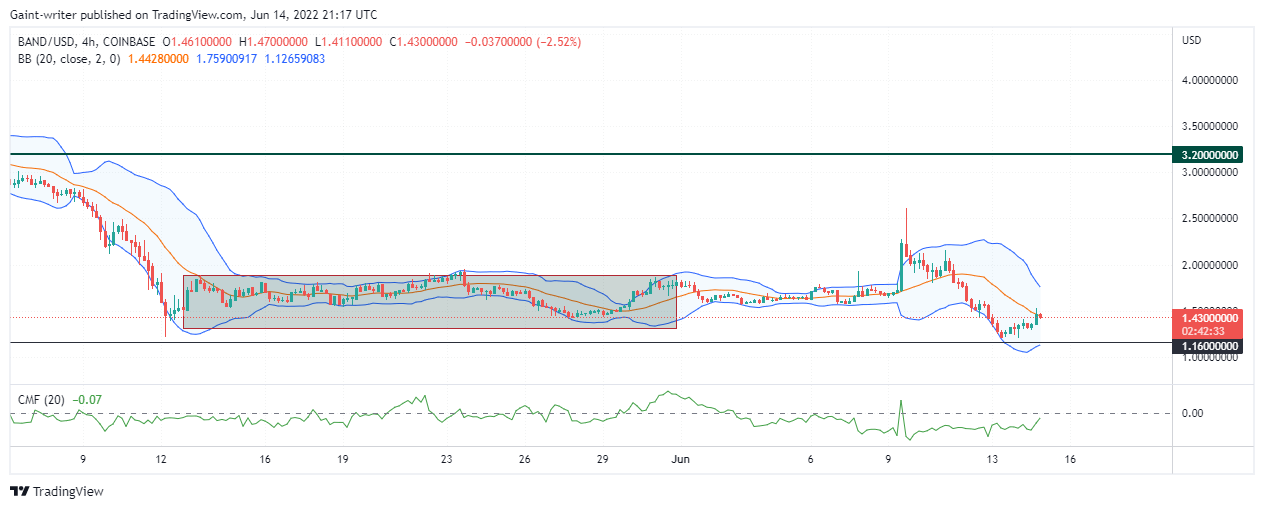
The 4-hour chart also displays a price squeeze before eventually breaking downward. The buyers are already settling price orders above the 1.1600 key price level. The Money Flow Index shows a signal to cross the buying region as buyers prepare for a price rise.
How To Buy Lucky Block
Note: Cryptosignals.org is not a financial advisor. Do your research before investing your funds in any financial asset or presented product or event. We are not responsible for your investing results.