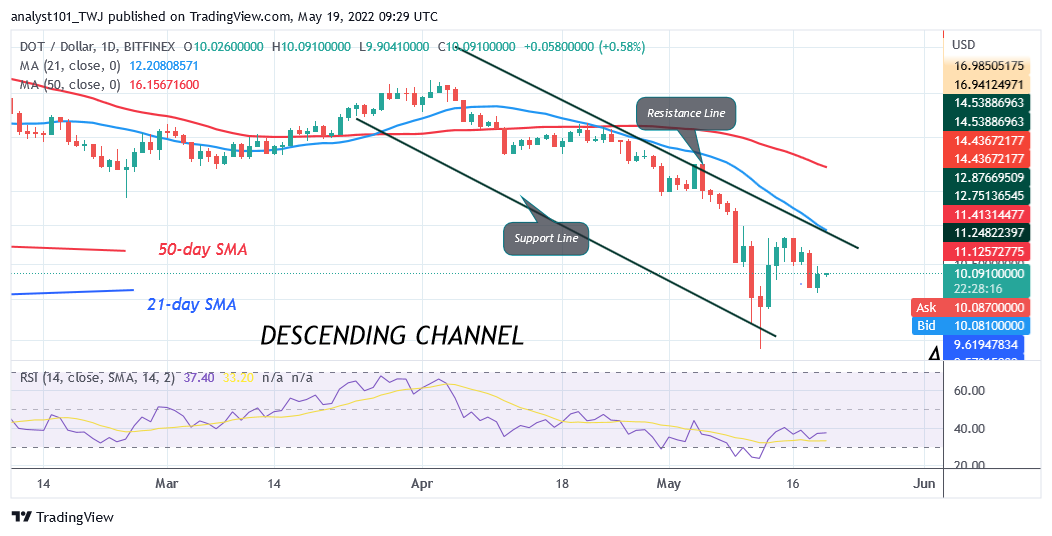
Polkadot Trades in a Range but Unable to Sustain above $12
Estimated Reading Time: 2 minutes
Don’t invest unless you’re prepared to lose all the money you invest. This is a high-risk investment and you are unlikely to be protected if something goes wrong. Take 2 minutes to learn more

Free Crypto Signals Channel
Polkadot (DOT) Long-Term Analysis: Bearish
Polkadot’s (DOT) price has continued to fluctuate between $8 and $12 price levels but unable to sustain above $12. Initially, buyers attempted to keep the price above $12 resistance but were repelled. Subsequent upward moves have been hindered. On the downside, the bears are also finding it difficult to break below the $7.18 support. The candlestick on May 12 has a long tail pointing to the current support. This describes that the current support has strong buying pressure. Because of this, DOT price will continue its range-bound move, until the range-bound levels are breached.
Polkadot (DOT) Indicator Analysis
Because of the recent upward correction, DOT price is at level 37 of the Relative Strength Index for period 14. Buyers are emerging from the oversold region to push prices upward. The altcoin is above the 40% range of the daily stochastic. The market has resumed bullish momentum. the 21-day line SMA and the 50-day line SMA are sloping southward indicating the downtrend.
Technical indicators:
Major Resistance Levels – $48, $52, $56
Major Support Levels – $32, $28, $24
What Is the Next Direction for Polkadot (DOT)?
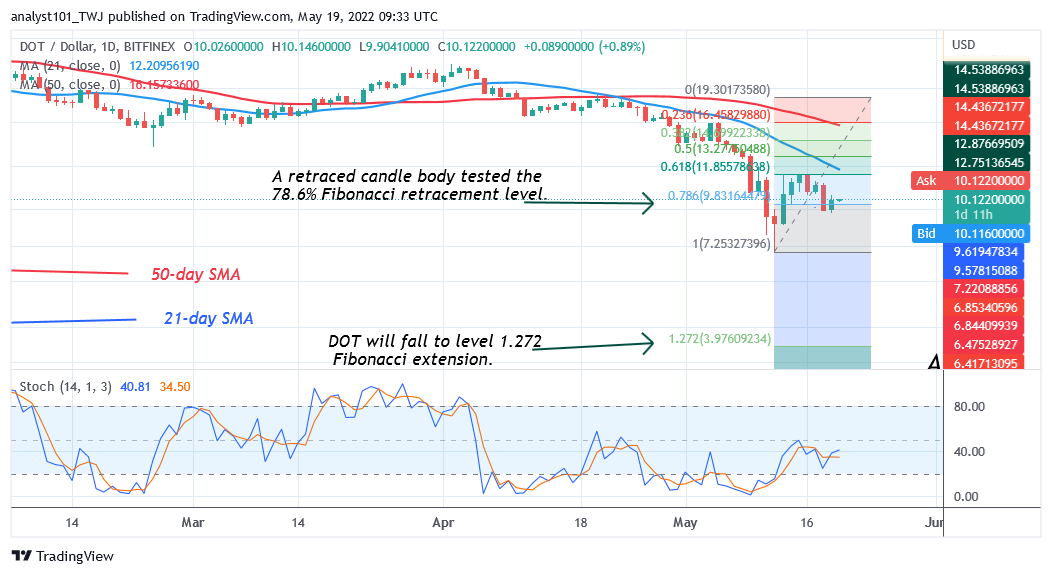
DOT price is still in a downward correction as it trades in a confined range but unable to sustain above $12. The altcoin will trend once the range-bound levels are breached. Meanwhile, on May 12 downtrend, a retraced candle body tested the 78.6% Fibonacci retracement . The retracement suggests that DOT price will fall to level 1.272 Fibonacci extension or level $3.97. From the price action, the DOT price is still trading in a confined range.
You can purchase crypto coins here. Buy LBlock
Note: Cryptosignals.org is not a 1a financial advisor. Do your research before investing your funds in any financial asset or presented product or event. We are not responsible for your investing results