BNB Makes a Comeback as It Rallies to the $220
Estimated Reading Time: 2 minutes
Don’t invest unless you’re prepared to lose all the money you invest. This is a high-risk investment and you are unlikely to be protected if something goes wrong. Take 2 minutes to learn more

BNB (BNB) Long-Term Analysis: Bullish
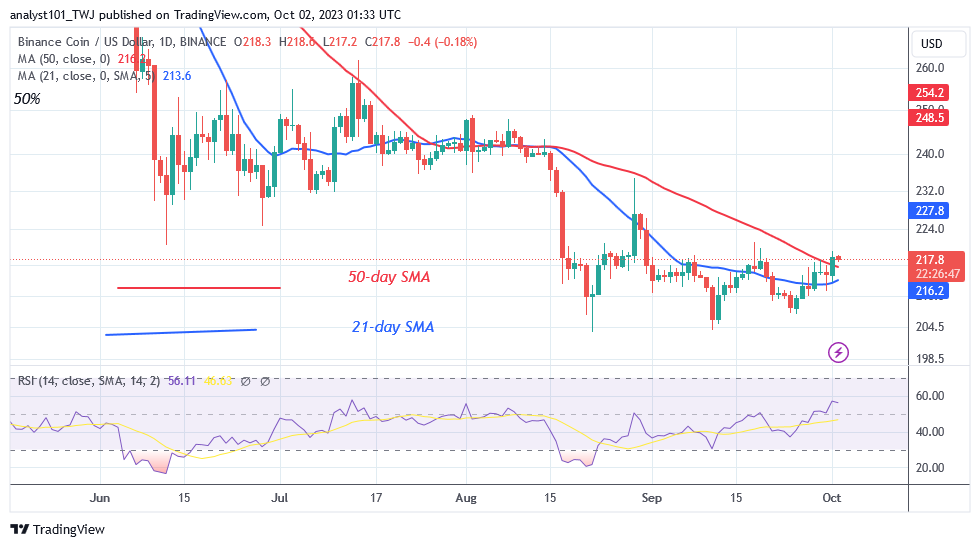
The price of BNB (BNB) is now trading in the positive trend zone as it rallies to the $220. The crypto’s value has reached a high of $219.50 as of the time of writing. The current bullish momentum is anticipated to continue heading higher if the price bars remain above the moving average lines. The currency is anticipated to achieve its former peak price levels of $220 and $232.
However, the previous highs are expected to reject the present upward movement. When BNB/USD achieves a high of $220, it is considered to be overbought.In the interim, the value of the coin has increased.
Technical indicators:
Major Resistance Levels – $440, $460, $480
Major Support Levels – $240, $220, $200
Binance Coin (BNB) Indicator Analysis
BNB is moving upward as it achieves the Relative Strength Index level 57 for period 14. The coin has additional room to move upward, therefore the trend might continue. When the price bars are above the moving average lines, the cryptocurrency asset will increase. The altcoin is currently in a positive momentum as it moves closer to the overbought area of the market.
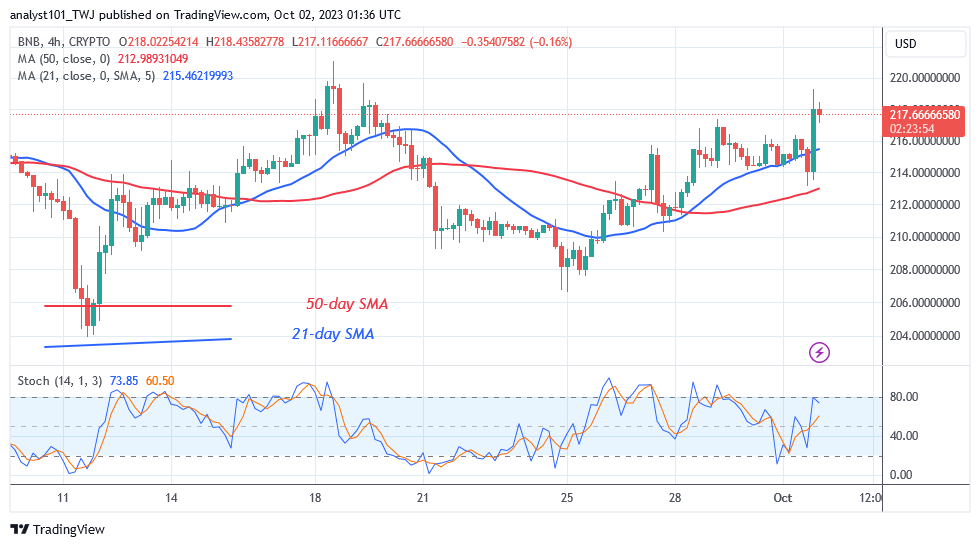
It is above the daily Stochastic’s level 79. BNB is already trading in an area of the market that is overbought.
What Is the Next Direction for Binance Coin (BNB)?
BNB/USD is making a comeback from the chart’s bottom as it rallies to the $220. First of all, it has broken over the lines of the moving average. As it approaches the high of $220, it can encounter opposition. The altcoin will fluctuate below its most recent high before being rejected. The moving average lines and the $220 barrier will represent the coin’s trading range.
You can purchase crypto coins here. Buy LBLOCK
Note: Cryptosignals.org is not a financial advisor. Do your research before investing your funds in any financial asset or presented product or event. We are not responsible for your investing results