BNB Stabilizes above the $210 Support as It Trades Modestly
Estimated Reading Time: 2 minutes
Don’t invest unless you’re prepared to lose all the money you invest. This is a high-risk investment and you are unlikely to be protected if something goes wrong. Take 2 minutes to learn more

BNB (BNB) Long-Term Analysis: Bearish
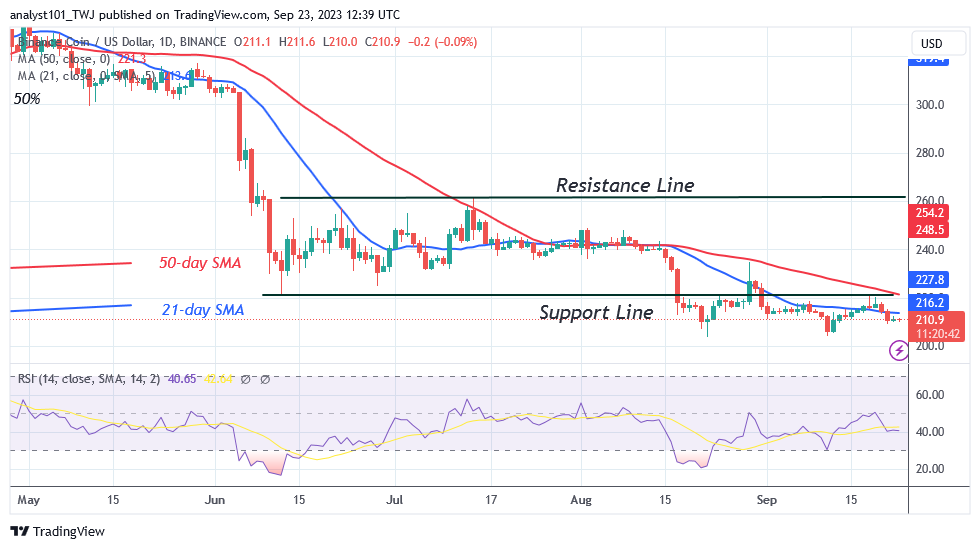
The BNB (BNB) price is above the $203 support as it trades modestly, but the 21-day SMA is limiting the upward movement. The cryptocurrency is now trading at the bottom of the chart. It varies between pricing levels of $203 and $212. BNB was rejected at the current high on September 21 as it found support above $209.
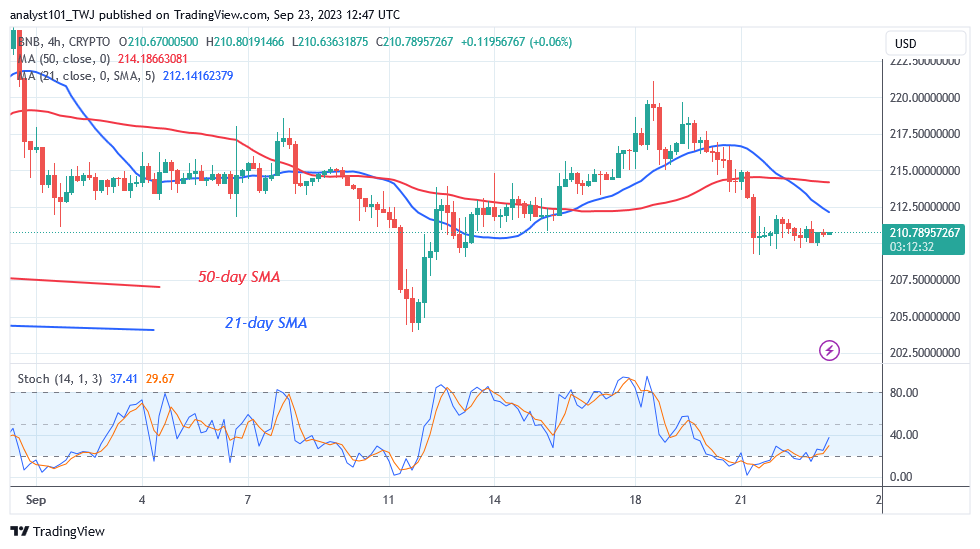
The Doji candlesticks have developed in the last 48 hours while BNB has traded modestly. BNB/USD moves slowly as a result of the Doji candlesticks. The cryptocurrency is now trading in the midst of its price range.
Technical indicators:
Major Resistance Levels – $440, $460, $480
Major Support Levels – $240, $220, $200
Binance Coin (BNB) Indicator Analysis
BNB is stabilizing above the current Relative Strength Index support level of 40 for period 14. The price bars remained below the moving average lines, indicating that the altcoin has the potential to fall. BNB is in a bearish trend below the daily Stochastic level of 25.
What Is the Next Direction for Binance Coin (BNB)?
BNB/USD is now at the bottom of the chart as it trades modestly. The coin is now trading in a new price range of $203 to $212. The Doji candlesticks have emerged since September 21 as BNB trades softly. Because of the presence of Doji candlesticks, price movement has been confined above the current support level of $210.
You can purchase crypto coins here. Buy LBLOCK
Note: Cryptosignals.org is not a financial advisor. Do your research before investing your funds in any financial asset or presented product or event. We are not responsible for your investing results