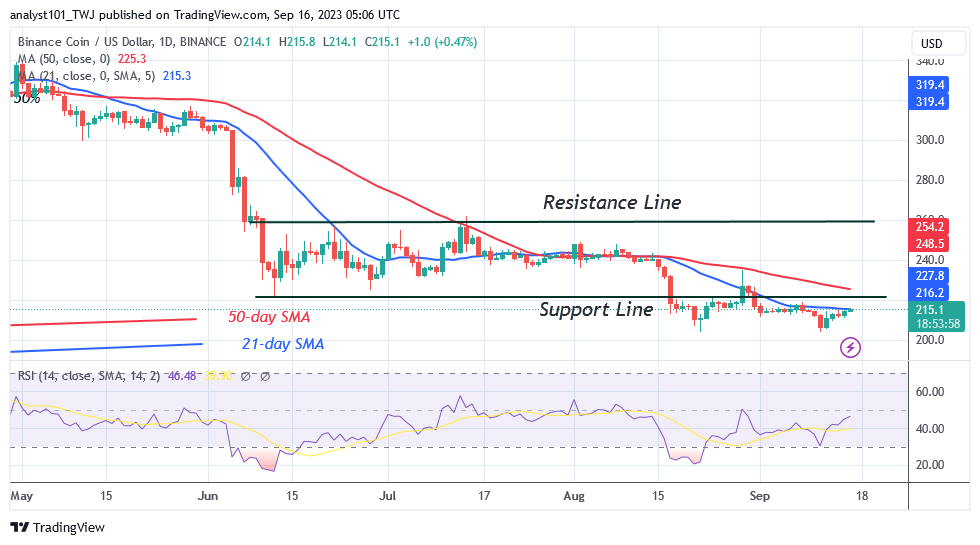
BNB Fails to Resume Uptrend as It Is Stuck at the $216 High
Estimated Reading Time: 3 minutes
Don’t invest unless you’re prepared to lose all the money you invest. This is a high-risk investment and you are unlikely to be protected if something goes wrong. Take 2 minutes to learn more

BNB (BNB) Long-Term Analysis: Bearish
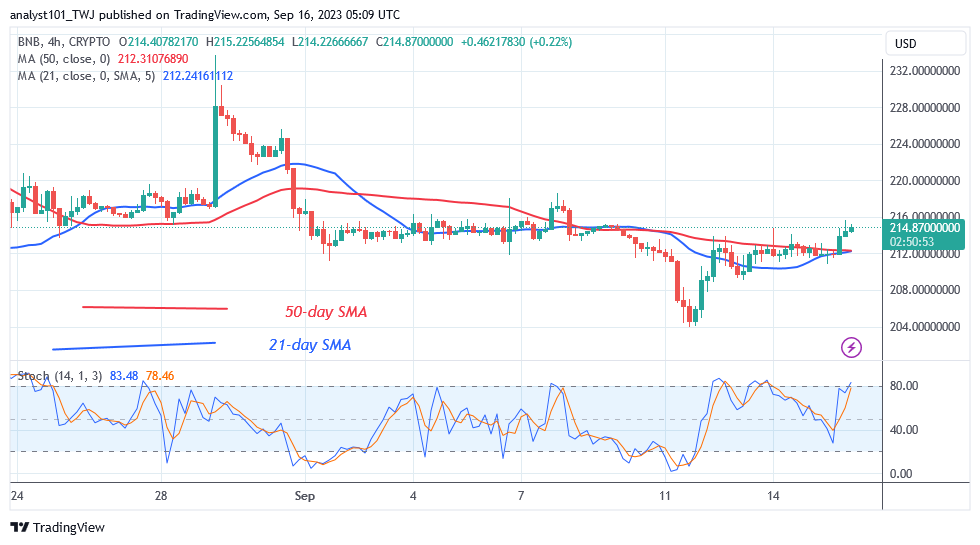
BNB (BNB) price makes an upward correction but is stuck at the $216 high. The positive momentum was short-lived, as the altcoin became trapped around the 21-day simple moving average (SMA) or barrier at $216. Nonetheless, the cryptocurrency has failed to establish a bullish trend after the August 21 price dip.Today, BNB has dropped to a low of $214 due to rejection at the 21-day SMA.
On the plus side, additional gains in the altcoin are unlikely because the market has reached overbought territory. If sellers emerge in the overbought region, BNB/USD will fall. The market will go back to its prior low of $203. In contrast, the cryptocurrency will fall and begin a range-bound move between $200 and $216.
Technical indicators:
Major Resistance Levels – $440, $460, $480
Major Support Levels – $240, $220, $200
Binance Coin (BNB) Indicator Analysis
BNB is still in the bearish trend zone despite the recent correction. For period 14, it is at the Relative Strength Index level 46. In the bearish trend zone, the altcoin has the potential for additional decrease. The price bars are having difficulty penetrating the 21-day SMA. The altcoin will fall if the latest high is rejected. The drop is necessary as the coin approaches the overbought zone.
It is higher above the daily Stochastic level of 80.
What Is the Next Direction for Binance Coin (BNB)?
The cryptocurrency asset is trading in the market’s overbought zone as it is stuck at the $216 high. It is currently trading below the $216 high. On the plus side, a break above the current high will propel the altcoin over the moving average lines. The bearish trend will rise over the moving average lines. The bullish momentum will peak at $240.
If buyers fail to break through the recent high, the market would fall to the prior low of $203,
You can purchase crypto coins here. Buy LBLOCK
Note: Cryptosignals.org is not a financial advisor. Do your research before investing your funds in any financial asset or presented product or event. We are not responsible for your investing results