UMA (Umausd) Is Leaning Towards an Upsurge
Estimated Reading Time: 2 minutes
Don’t invest unless you’re prepared to lose all the money you invest. This is a high-risk investment and you are unlikely to be protected if something goes wrong. Take 2 minutes to learn more
UMA Analysis – The Market Is Leaning Toward an Upsurge From a Support Zone
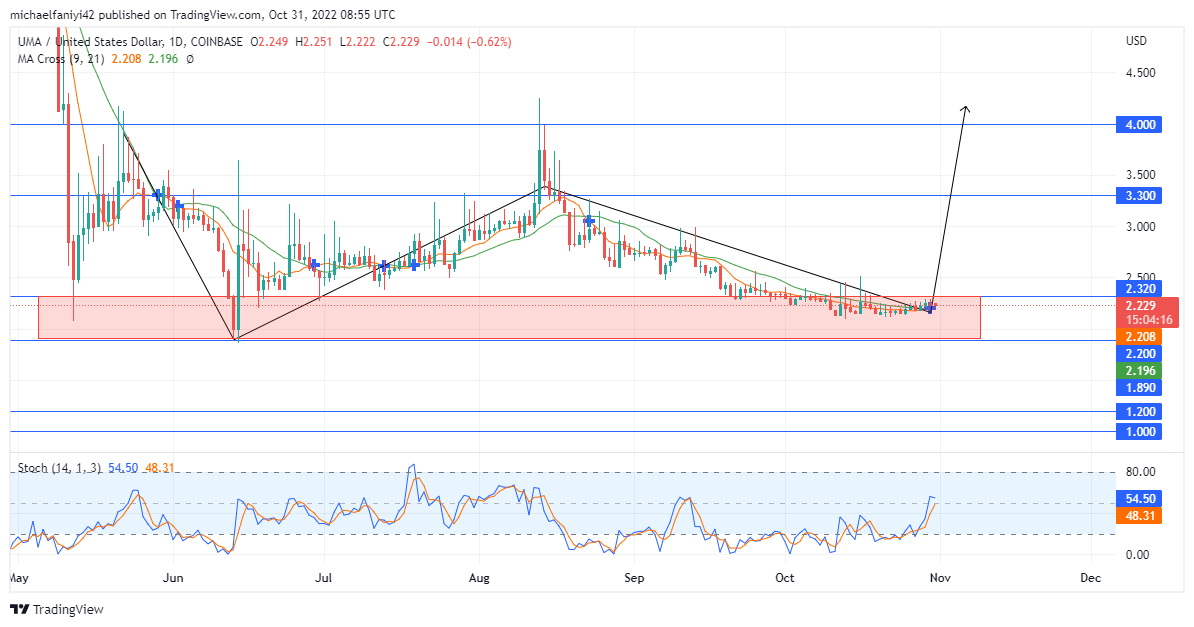
UMAUSD is leaning towards an upsurge after several days of being laid back. The coin is about to conform to a double-bottom bullish structure that will drive the price higher. However, activities in the market have been sluggish since the start of October when the market dropped to around the $2.320 price level. Since then, the enthusiasm to push higher had been dampened. But now, the coin is finally leaning toward continuing its adventure.
UMAUSD Critical Levels
Resistance Levels: $4.000, $3.300
Support Levels: $2.320, $2.200
Generally, the bears are ruling the market. However, the buyers have not relented in looking for a way to pump the price. The constant trial to push the price up sees the coin test the $4.000 supply level at least twice. Although the market is now back in between the $2.320 and the $1.890 key levels, it only takes a determined push-up by the buyers to confirm the coin to a double-bottom market structure.
The double-bottom market structure will likely ensure that the coin breaks the $4.000 market cap and stabilize above it. Currently, while UMAUSD is leaning toward a breakout, it remains under bearish influence. The Stochastic Oscillator lines show a desire in the market to push up, hence the Stochastic Oscillator lines have bounced out of the oversold region, and trending upwards.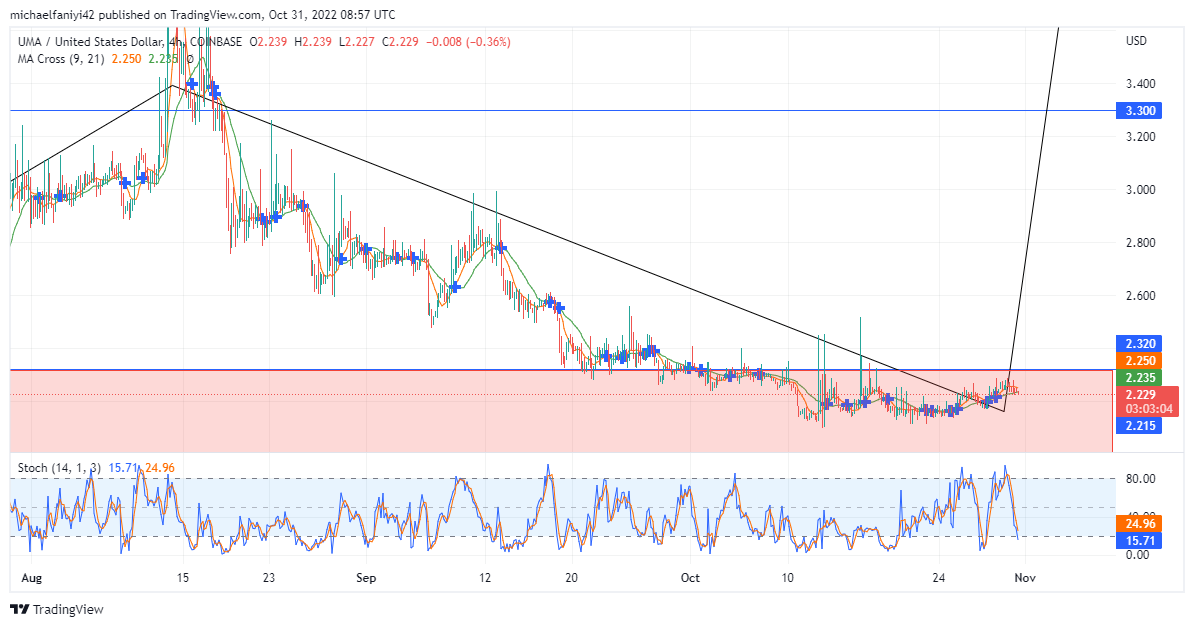
Market Expectation
Still, on the daily chart, the MA Cross has crossed upward once, but it has crossed upward multiple times from the oversold region. The Stochastic Oscillator lines of the 4-hour chart have risen to overbought and are undulating around the border. UMAUSD buyers will ride the price to $4.000 if they put in the effort to lift it above the $2.320 support zone.
You can purchase Lucky Block here. Buy LBLOCK
Note: Cryptosignals.org is not a financial advisor. Do your research before investing your funds in any financial asset or presented product or event. We are not responsible for your investing results.