Dogecoin (DOGE) Price Prediction: DOGE/USDT Still at Risk of Falling Lower
Estimated Reading Time: 2 minutes
Don’t invest unless you’re prepared to lose all the money you invest. This is a high-risk investment and you are unlikely to be protected if something goes wrong. Take 2 minutes to learn more

Dogecoin (DOGE) Price Prediction (April 14, 2025)
Dogecoin has been seeing only minimal gains in recent times. As a result, price activity hasn’t risen to significant levels, as buying momentum appears quite weak. Nevertheless, let’s take a close look at the market.
DOGE/USDT Long-Term Trend: Bullish (Daily Chart)
Key Price Levels:
Resistance: $0.1600, $0.2000, $0.2500
Support: $0.1500, $0.1000, $0.0500
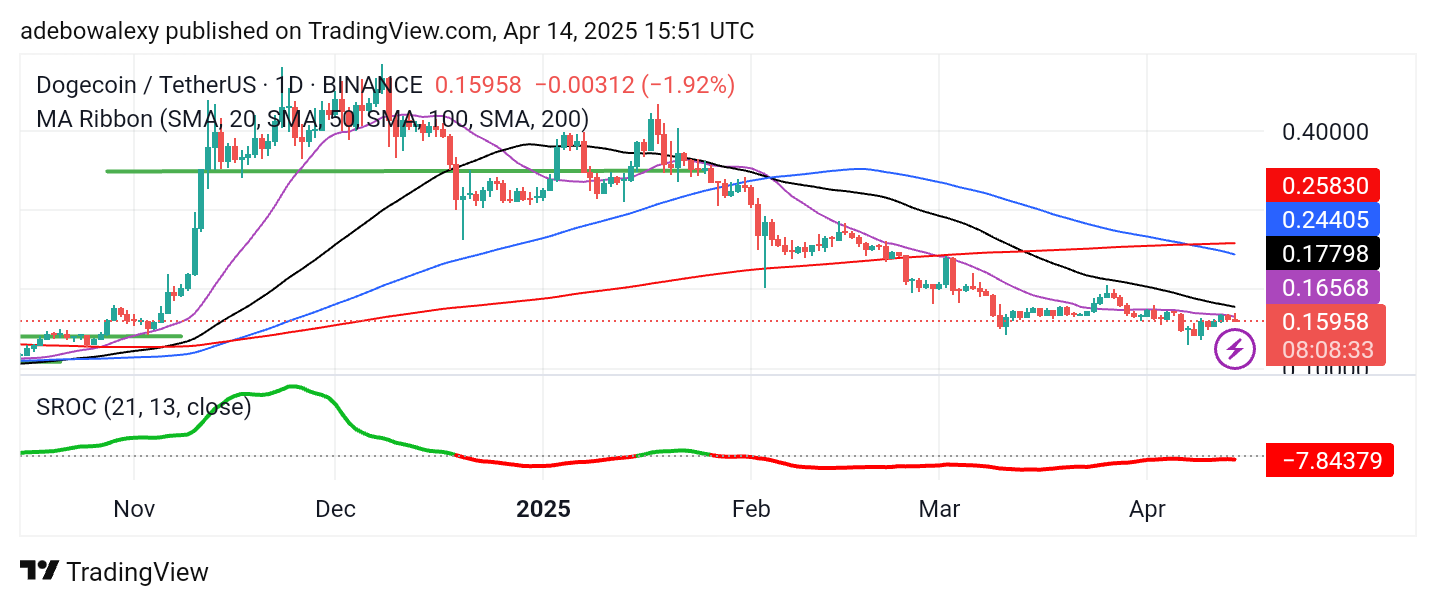
Price action has slightly moved upward from a previous support level of around $0.1500. Meanwhile, the latest price candle appears bearish after touching the 20-day Moving Average (MA) from below. Likewise, the Stochastic Rate of Change (SROC) indicator curve is positioned just below the 0.00 level. The line is also currently bearish, appearing red and staying below the equilibrium level of the indicator.
Dogecoin (DOGE) Price Prediction: DOGE/USDT’s Minimal Upward Retracement Meets Rejection
As noted earlier, the Dogecoin market has been climbing steadily, following Bitcoin’s upward momentum. However, as soon as price action tested the 20-day MA, it rebounded downward. This behavior suggests that price activity is facing a strong resistance ahead.
Furthermore, the movement of the Stochastic ROC indicator lines hints that bullish forces aren’t dominant in this market. Although the terminal of the indicator lines hovers just below the 0.00 level, there is still a chance for bulls to overcome the 20-day MA resistance.
Dogecoin (DOGE) Price Prediction: DOGE/USDT Bullish Momentum Stalls
Looking at Dogecoin on a much smaller time frame, price action appears to be facing strong rejection at the 200-day MA curve. Price had consolidated for a while above the 100-day MA line; however, once the market hit the 200-day MA, prices dipped significantly in the shorter time frame.
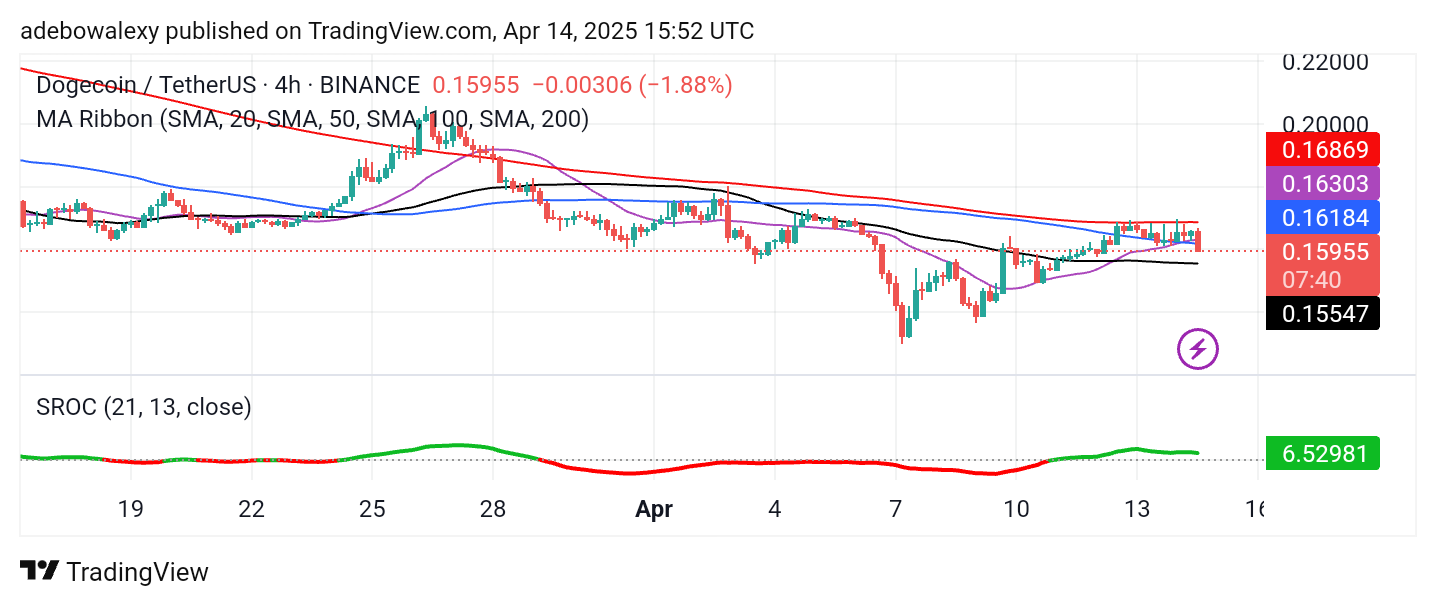
This move pushed the market below the converging 20-day and 100-day MA lines. Similarly, the Stochastic ROC lines are moving sideways just above the equilibrium level. Consequently, price action may descend further toward the $0.1500 level—unless market fundamentals trigger a reversal.