BNB (BNB/USDT) Resumes Rally as Bullish Momentum Pushes Price to New Highs Amid Market Optimism
Estimated Reading Time: 3 minutes
Don’t invest unless you’re prepared to lose all the money you invest. This is a high-risk investment and you are unlikely to be protected if something goes wrong. Take 2 minutes to learn more
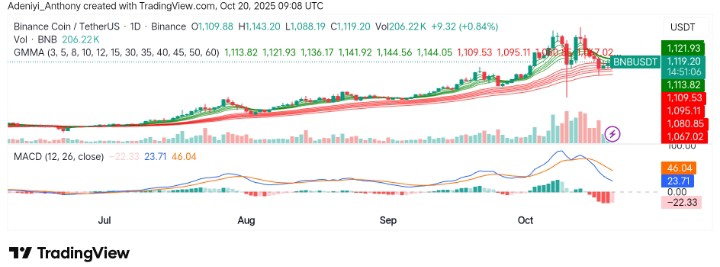
After the market shock that pulled the price of BNB against Tether towards $1,200, the market for this pair has shown a mixed sentiment, bullish at some points. However, it appears that the pair is preparing for a big move after a brief pullback in its track.
Recently, the price has peaked at around $1,145 and experienced a brief pullback toward the $1,125 area. Meanwhile, the trend remains bullish, but there could be short-term consolidation in the near term.
Currently, BNB trades at $1,119 with more than 206 thousand traded volumes at the beginning of the week.
Technical Indicators
Major Resistance Levels: $1,150, $1,203, and $1,500
Major Support Levels: $1,109, $1,000, and $987
BNB Technical Analysis
Technically, BNB against Tether has been performing better on the daily chart, forming higher highs while trending upward. However, it appears that the upside action was distorted as the market heads towards its closest support around $1,109.
As it stands, the Guppy Multiple Moving Averages (GMMA) signal BNB seems to be ready for another spike, but the MACD indicates some elements of bearish action are still present in the market as the histogram displays red.
To this end, only when the pair reclaims the $1,203 level will the market confirm further bullish action.
$BNB: BNB is following a similar structure like Bitcoin. It is likely that the support zone will be tested once more. Support is between $742 and $934. pic.twitter.com/rO2GTONs7c
— More Crypto Online (@Morecryptoonl) October 17, 2025
Meanwhile, @Morecryptoonline suggested some days ago that BNB might be mimicking Bitcoin’s structure, and BNB may retest support around 934 before a further leg up.
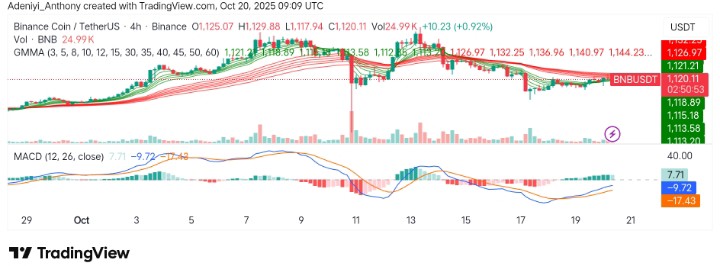
BNB/USDT Analysis: Maintaining the Trend
On the 4-hour chart, it appears that BNB/USDT appears to be pulling back after a recent surge towards $1,145; it seems there is more bullish action to come as the GMMA compress together for a bullish crossover with growing momentum. Additionally, the MACD appears to be supporting this stance, as the histogram displays positivity, indicating the pair may be consolidating, but more upside potential may be seen if bullish participation increases as time goes on.
To this end, if the bulls can maintain the current outlook, a leap into $1,200 may be recorded before a move to its previous all-time high.
You can purchase crypto coins here. Buy Crypto