0x (ZRXUSD) Price Falls Out After Aggregation
Estimated Reading Time: 3 minutes
Don’t invest unless you’re prepared to lose all the money you invest. This is a high-risk investment and you are unlikely to be protected if something goes wrong. Take 2 minutes to learn more
ZRXUSD Analysis – Price Falls Out of Aggregation in Price Movement
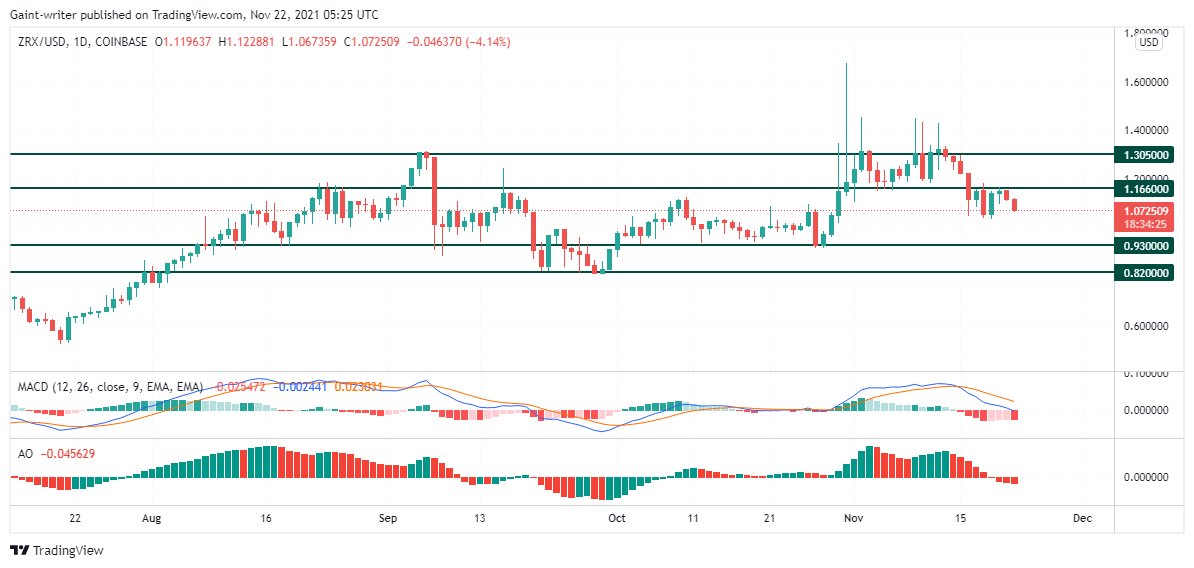
ZRXUSD price falls after aggregation in price movement. The structure of the market is assumed to now follow the sellers’ direction as the market now seeks to go low. When the vitality of the seller’s increases, the market will therefore go lower, seeking asylum close to the $0.9300 level of significance, and the price may even go below that level. This is defined to happen as long as the bulls are not causing any interference in the bearish structure of the market since the price is set to build bearish blocks.
ZRXUSD Significant Level:
Resistance Level: $1.3050, $1.1660
Support Level: $0.9300, $0.8200
ZRXUSD market before starting in a bearish direction was first at the regional level. The price was scarcely accumulated between the significant levels of $1.3050 and $1.1660. As the market aggregates at this level, the wicks of the candlesticks appear to be shooting out above the level. The market, however, experiences a downtrend following a market aggregation between those significant levels. Sellers, on the other hand, are more likely to market their way down to lower price levels during bearish moments.
The price movement continues its movement below the surface of the $1.1660 price level. There also appears to be a market reaction near the surface of this level. This is due to the bull’s concentration as they try to influence the market environment. They caused a return to the $1.1660 price level. The bears, however, accomplished price movement downward as they eventually took control. The MACD ( Moving Average Convergence and Divergence indicator) indicates a market structure in a bearish trend as the price is set to go lower.

Market Expectations
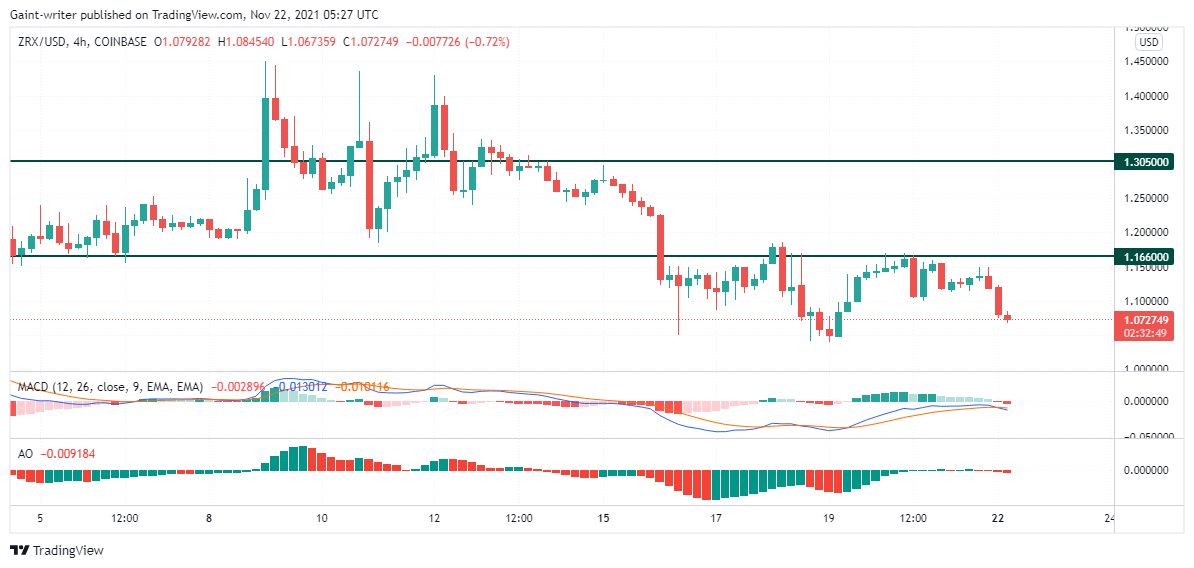
The structure of the market on the 4-hour chart shows price movement continuing in its bearish direction. The price is seen to have retested the market level several times, and the bears will eventually proceed downward. The awesome indicator shows a price increase in momentum. When price momentum continues to increase, the bears will tend to go lower, to a $0.9300 level of significance.
You can purchase crypto coins here: Buy Tokens
Note: Cryptosignals.org is not a financial advisor. Do your research before investing your funds in any financial asset or presented product or event. We are not responsible for your investing results.