UMA (UMAUSD) Sets Its Margin Below a Significant Level With Buyers’ Failure to Breakover
Estimated Reading Time: 3 minutes
Don’t invest unless you’re prepared to lose all the money you invest. This is a high-risk investment and you are unlikely to be protected if something goes wrong. Take 2 minutes to learn more

Free Crypto Signals Channel
UMAUSD Analysis – Price Sets Its Margin Below the $8.500 Significant Level With Buyers’ Failure to Break Over
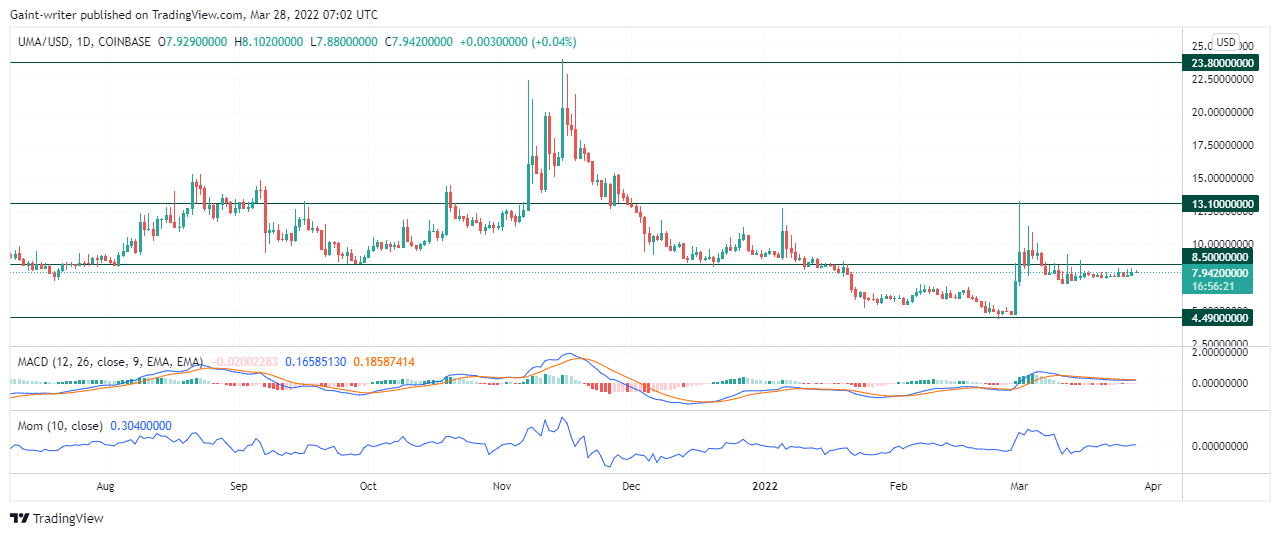
UMAUSD sets its margin below the $8.500 significant level with buyers’ failure to break over the market. The $8.500 level seems to be a strong resistance zone in the market. Despite the bulls’ participation in the market, they are not ready to witness a price breakthrough through $8.500. The price action in the market is currently neither pushing up nor going down in the market. Instead, UMAUSD is said to be accumulating in price. However, a change in price at the moment will bring about an alteration in the UMAUSD’s current tendency.
UMAUSD Significant Levels
Resistance Levels: $23.800, $13.100
Support Levels: $8.500, $4.490
As a result of the rise in momentum, the buyers could get the price right at the $4.490 level in the market. Therefore, the buy traders witnessed a strong pull beyond the $8.500 key level on the market but failed to arrive with a body candlestick at the $13.100 key level. The wick of the bull candle shows price rejection around this level. After that, the buyers stepped in again to change the price tendency. The price is now accumulating below $8.500 on the 1-day chart.
However, the market first follows the accumulation phase before rising to a significant point in the market. This brought about the buyers’ current display in the market. Shortly after, the bears set price action to follow the downtrend in the market. The bear market took price movement from the $23.800 significant level down to the $4.900 key level. As the market is accumulating, it is ready to change the price trend when there is more momentum in the price.

Market Expectations
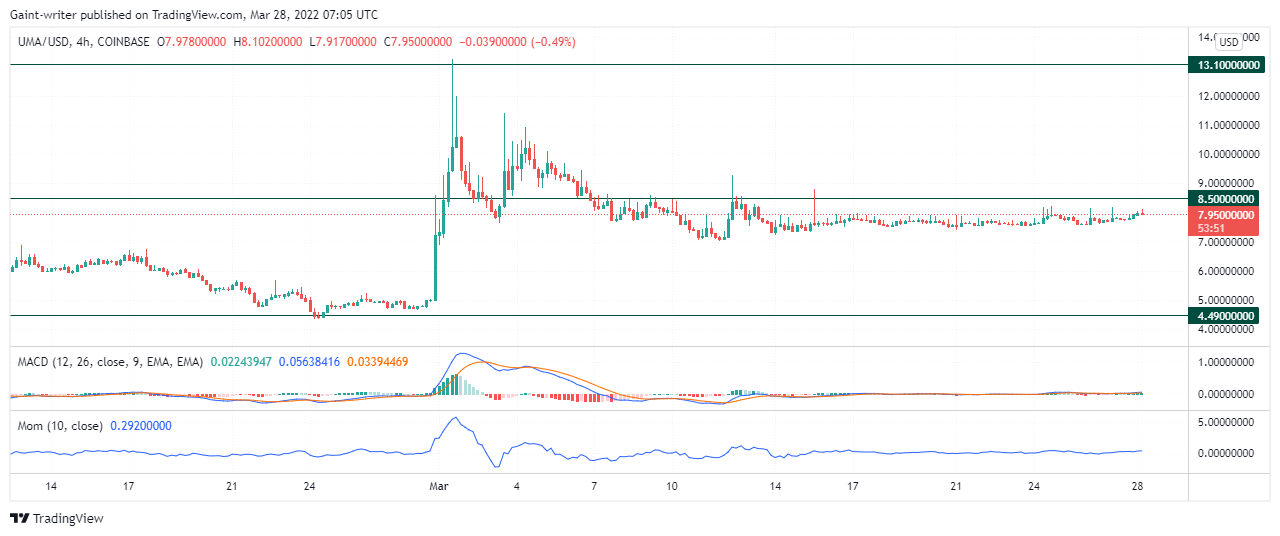
The 4-hour chart shows price disbursement in the UMAUSD market. Following price rejection at the $13.100 significant price, the bears are now accumulating the price below the $8.500 key level. Due to the accumulation, the momentum and the MACD (Moving Average Convergence and Divergence) indicator are at zero. As a result of bulls not being able to manipulate the price to break over, the sell traders should distribute the price action below $8.50.
How To Buy Lucky Block
Note: Cryptosignals.org is not a financial advisor. Do your research before investing your funds in any financial asset or presented product or event. We are not responsible for your investing results.