BNB (BNB/USDT) Rockets Toward $1,400 After Market Crash: Will Momentum Hold?
Estimated Reading Time: 3 minutes
Don’t invest unless you’re prepared to lose all the money you invest. This is a high-risk investment and you are unlikely to be protected if something goes wrong. Take 2 minutes to learn more

Given the recent unexpected market shock in the crypto market, one will be sure of one thing: a steady recovery. However, the case of BNB and Tether is not like that; the pair has surged drastically, recording a new high as institutional support increases.
Earlier, the pair opened at $1,302.65, recording a value as low as $1,283.44. However, a bullish momentum has taken the pair to a new high of around $1,375.00. As it stands, the Guppy Multiple Moving Averages (GMMA) and Stochastic RSI with the volume signal the pair has a long journey to the north. However, the major concern remains the sustainability of the momentum, as $1,400-$1,500 may serve as a supply zone.
Currently, BNB trades at $1,316.70 with more than 492 thousand traded volumes for the day.
Technical Indicators
Major Resistance Levels: $1,380, $1,500, and $1,600
Major Support Levels: $1,300, $1,250, and $1,150
BNB Technical Analysis
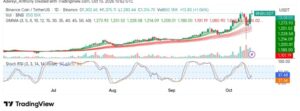
Technically, BNB against Tether has been bullish for a substantial part of the day despite the Oct 10 dip. As it stands, the set of short-term EMAs appears to be clearly visible above the long-term EMAs. This suggests the pair is enjoying buyers’ support as the volume increases with the price above the GMMA.
Additionally, the Stochastic RSI appears to be showing positive signs, as the lines are now pointing to the north (37.44) from an oversold region.
To this end, the combination of a solid technical trend alongside institutional interest seems to be driving momentum, and building a base above $1,380 is crucial for a continued rally.
$BNB has once again shown its strength.
Even after a heavy correction, it bounced back with confidence.
Many high-leverage traders got wiped out, but the smart ones are still in the game.
The trend is turning bullish again. Stay patient. pic.twitter.com/4Z0Iwo6kho
— Crypto King (@CryptoKing4Ever) October 12, 2025
Moreover, @Cryptoking4ever reiterated the need to be patient by highlighting the recent bounce displayed by BNB. However, the analyst still suggests caution as the market tends towards the historic high zone.
BNB/USDT Short-term Analysis: Expectation
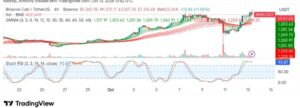
On the 4-hour chart, BNB/USDT appears to be exhibiting a continued uptrend as the sets of moving averages display a bullish crossover with increasing volumes.
However, the Stochastic RSI on this timeframe displays an extreme overbought condition with outstretched lines above the 95-mark level. This suggests that the price might need to dip a little before another leg upside.
To this end, the pair is on a strong bullish trend, but the momentum oscillator signals a potential pullback; however, a move above $1,380 would indicate a sustained push to the north.
You can purchase crypto coins here. Buy Crypto