BNB (BNB/USDT) Eyes New Highs as Bullish Momentum Strengthens
Estimated Reading Time: 3 minutes
Don’t invest unless you’re prepared to lose all the money you invest. This is a high-risk investment and you are unlikely to be protected if something goes wrong. Take 2 minutes to learn more

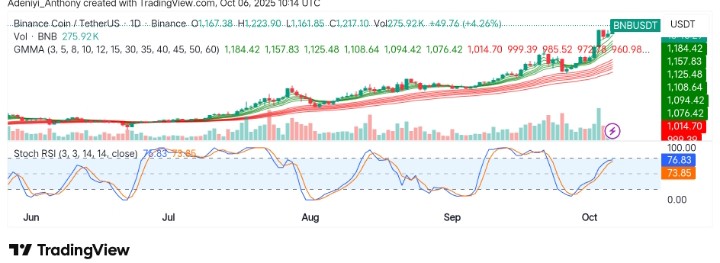
The market for BNB against Tether has experienced a strong uptrend, which has been marked by a strong price surge recently. However, the price stands at around $1,200, reflecting more than 4% daily increase, with positive market sentiment.
Technically speaking, the Stochastic RSI indicates an overbought state, indicating that even if the price is now high. Meanwhile, there may still be an opportunity for a move to the north, particularly if demand remains high. Furthermore, a bullish trend with a good outlook is indicated by the Guppy Multiple Moving Averages (GMMA), signaling the pair is building a strong base above the current level.
Currently, BNB trades at $1,215, recording more than 274 thousand traded volumes for the day.
Technical Indicators
Major Resistance Levels: $1,223, $1,300, and $1,500
Major Support Levels: $1,156, $1,124, and $1,107
BNB Technical Analysis
Technically, BNB against Tether has been respecting an ascending channel, and the price is currently at the upper boundary of this channel, with increasing buying pressure and higher volume. However, the GMMA and Stochastic RSI signal the possibility of a continued bullish trend.
To this end, a break above $1,200 would confirm the continuation of the uptrend, with $1,156.35 and $1,124.49 acting as support levels. However, should the price dip, the support levels at $1,107.84 and $1,093.74 would likely act as critical areas for price stabilization.
$BNB is showing perfect trend continuation.
Breakout 1 in July → strong rally
Breakout 2 in September → another big move
Breakout 3 is happening now → momentum building againThis is not random. It is a clear structural climb toward new highs.
Target: $1500+ pic.twitter.com/ViMsWeUIm1
— Crypto King (@CryptoKing4Ever) October 3, 2025
Meanwhile, @Cryptoking4ever is optimistic about the intended breakout, listing previous dates of massive bullish moves. Finally, the analyst believes BNB is about to build a base above another resistance level.
BNB/USDT Analysis: Gearing Up for an Explosive Move
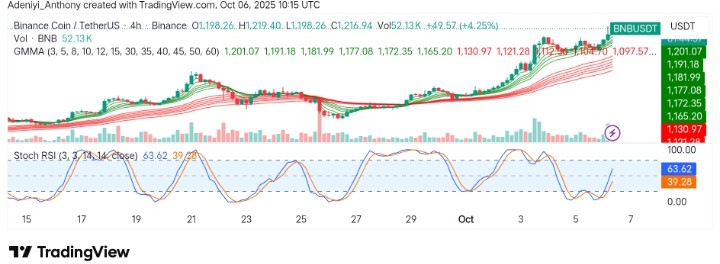
On the 4-hour chart, BNB/USDT appears to be on a continued uptrend, operating above the cluster of exponential moving averages. As it stands, the GMMA seems to be diverging further as the gap between the long-period EMAs and short-period EMAs widens.
From another angle, the Stochastic RSI signals the presence of bullish strength, as both lines of the indicator point to the north.
To this end, both indicators on the 4H chart showing BNB against Tether suggest more improvement is on the way, and a close above $1,200 in the current session will determine a move above $1,300 in the coming session.
You can purchase crypto coins here. Buy Crypto