BNB (BNB/USDT) Trend Set to Continue Beyond $1,000: What’s Next?
Estimated Reading Time: 3 minutes
Don’t invest unless you’re prepared to lose all the money you invest. This is a high-risk investment and you are unlikely to be protected if something goes wrong. Take 2 minutes to learn more
Lately, the market for BNB against Tether has been making waves. The pair has seen impressive growth in recent weeks. At the moment, the pair is trading just above the $1,000 mark after opening around $993 today, marking a significant milestone.
Recently, the overall sentiment in the market has been bullish. Also, the price action seems to be supported by an upward-sloping moving average ribbon. This signals potential continuation, but the trading volume remains a factor, as the upper and lower price limits continue to dictate whether the momentum can be sustained.
Currently, BNB trades at $1,008.31, recording 77.88 thousand traded volumes in the early hours of the trading week.
Technical Indicators
Major Resistance Levels: $1,011, $1,030, and $1,080
Major Support Levels: $991, $900, and $810
BNB Technical Analysis
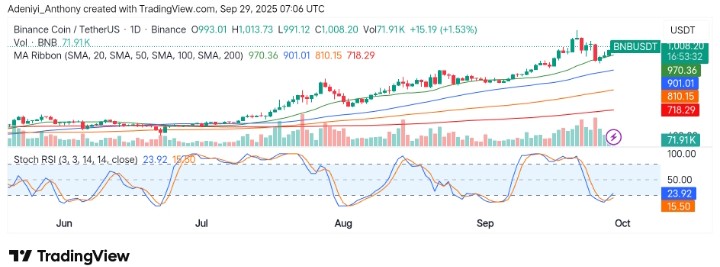
The market for BNB against Tether has been gaining traction for several weeks, with a steady uptrend supported by its simple trend lines. As it stands, this suggests that bulls are in control, and recent dips have been met with buying pressure.
From another angle, the Stochastic RSI from an oversold region signals a move to the upside. However, the daily traded volumes appear to be low as the pair’s price attempts to build on the $1,000 support level.
To this end, for the price to continue building on immediate support momentum, it must increase, and immediate support at $1,010 must be broken at a sustainable rate; otherwise, the price may continue to rotate within $1,000 and $900.
I wouldn’t be surprised at all 🚀 Even in choppy weeks, $HODL has proven consistency— $BNB rewards, long-term security, and a community that keeps building. That steady momentum is what sets the tone.@HODL_Official https://t.co/uit1bvegKm
— $HODL King 🏆 (@jDOOO9) September 29, 2025
Meanwhile, @JDooo9 in a post has expressed strong optimism in BNB, stating that even during weeks of directionless movement, the coin has shown consistency, and the positivity at the beginning of this week means a lot.
BNBUSDT Short-term Analysis: What to Expect
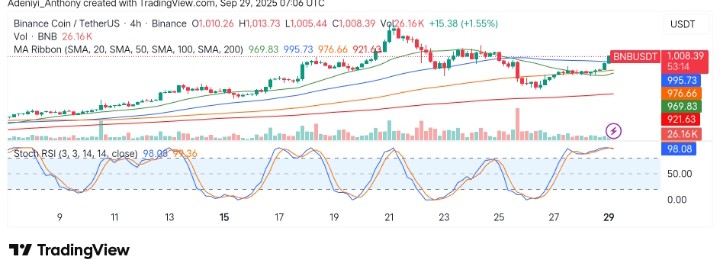
On the 4-hour chart, BNB/USDT is trading just above the $1,000 mark, indicating a strong bullish sentiment and providing a granular view of the daily chart. In this timeframe, the price appears to be sitting comfortably above all major moving averages, signaling a bullish reign. However, the Stochastic RSI is in overbought territory (98.08), signaling that BNB may be due for a short-term correction.
Despite the overbought conditions, the pair needs to grind higher, as failure to break through immediate resistance at $1,010 could result in a pullback to support around $976, making it important for bullish momentum to increase.
You can purchase crypto coins here. Buy Crypto