$SPONGE (SPONGE/USD) Bulls Battle Resistance, Eyeing Breakout Towards $0.00004
Estimated Reading Time: 3 minutes
Don’t invest unless you’re prepared to lose all the money you invest. This is a high-risk investment and you are unlikely to be protected if something goes wrong. Take 2 minutes to learn more

The SPONGE/USD market recently broke down from a prolonged standoff between buyers and sellers, which persisted between the $0.000035 and $0.000038 price levels. The bears suddenly took control, causing the price to plummet to $0.00002, a critical support level. Following this sharp decline, the market stabilized around the $0.00002 level before beginning a gradual push through bearish resistance. It is now slowly ascending towards the $0.00004 level. Although bearish sentiment remains strong, the bulls are showing signs of recovery, and upward momentum has started to take hold.
Key Market Dynamics:
- Resistance Levels: $0.0010, $0.0011, $0.0012
- Support Levels: $0.000020, $0.0000195, $0.000019
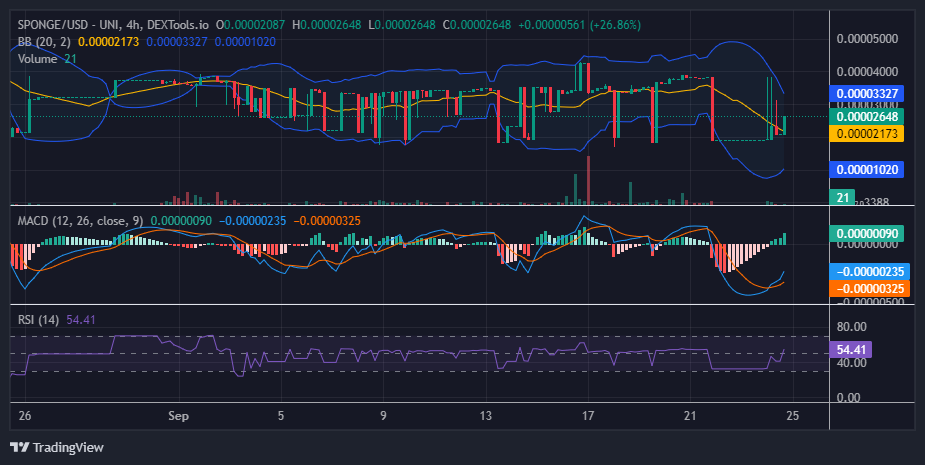
$SPONGE (SPONGE/USD) Technical Outlook
The recent short-term bearish pullback was followed by a period of consolidation around the $0.00002 price level, during which the Bollinger Bands began to indicate a downward price channel. However, the market is now gradually recovering, pushing through resistance as it approaches the $0.00004 level, with the current price at $0.000026.
Historically, the $0.00002 level has proven to be a significant support, as price action has consistently held above this point. We are now witnessing a recovery from this level. Looking at the Relative Strength Index (RSI), a bullish crossover has occurred below the zero line, with the faster line crossing above the slower one—signaling a bullish reversal. Additionally, the gap between the two MACD lines is widening, further confirming bullish momentum. With the price now trading above the 20-day moving average, this crypto signal presents a strong opportunity for investors to take long positions and buy for potential profit.
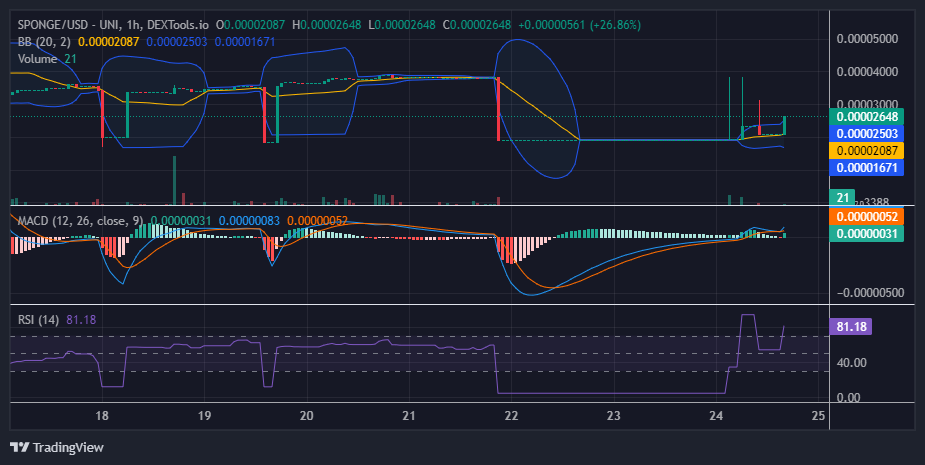
$SPONGE 1-Hour Chart Insights
The 1-hour chart shows strong bullish sentiment in the lower price zones, particularly around the $0.000019 level, just below $0.00002. The bearish momentum encountered a solid resistance here, causing the SPONGE/USD market to stall and consolidate for a period. However, recent market activity indicates a gradual recovery, with the price now rising steadily towards the $0.00004 level.
Buy $SPONGE!
Stop scrolling. Go touch some grass. pic.twitter.com/MdKgle8ISy
— $SPONGE (@spongeoneth) September 21, 2024
Join the SPONGE community and be part of the next big crypto sensation! Buy Sponge ($SPONGE) today!