$SPONGE (SPONGE/USD): A Battle of Bullish Forces
Estimated Reading Time: 3 minutes
Don’t invest unless you’re prepared to lose all the money you invest. This is a high-risk investment and you are unlikely to be protected if something goes wrong. Take 2 minutes to learn more

The $SPONGE market has demonstrated impressive resilience, steadily approaching the pivotal $0.00004 price level. Recently, the bulls managed to seize the $0.000035 mark, which had acted as a formidable bearish resistance in the past. Bears had persistently limited price movements above this threshold. However, following the bullish breakthrough on September 16, the bearish stance at this level has weakened, prompting bears to retreat toward the $0.00004 zone.
Key Market Dynamics:
- Resistance Levels: $0.0010, $0.0011, $0.0012
- Support Levels: $0.000020, $0.0000195, $0.000019
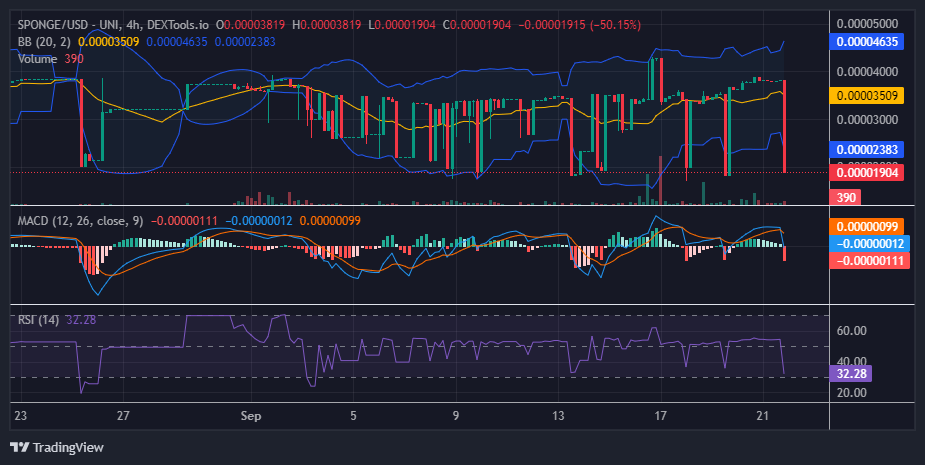
Technical Outlook for $SPONGE (SPONGE/USD)
Despite the sharp bearish movement observed in the latest trading session, SPONGE’s technical analysis indicates an increasing bullish sentiment as the market nears the crucial $0.00004 price point. While volatility persists, the sustained price action above $0.000035 hints at a potential upward breakout. The recent bearish candlestick, which momentarily dropped the price to the $0.00002 level—a significant support zone for bullish traders—may struggle to dip below this essential support, especially since the volume indicator does not show enough momentum to support further declines. This could encourage traders to begin buying at this level, anticipating a rebound in price.
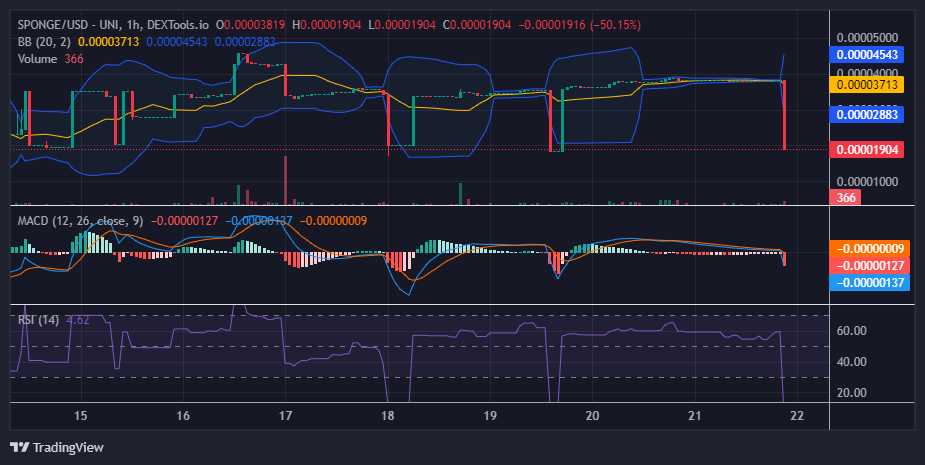
1-Hour Chart Analysis for $SPONGE (SPONGE/USD)
From the perspective of the 1-hour chart, the market continues to indicate a potential breakout. Despite a recent steep decline in price, the Relative Strength Index (RSI) fell briefly below the 30 level, signaling an oversold condition. This suggests that further selling pressure may diminish, increasing the likelihood of a market reversal and upward trend, potentially reaching the $0.00004 level.
Recent price movements and technical indicators for SPONGE suggest a bullish outlook. Although market volatility remains a consideration, the chances for a significant uptrend are rising. Investors should keep a close watch on price trends and key support and resistance levels to capitalize on potential opportunities.
Buy SPONGE/USD!
Onwards and upwards 🚀 pic.twitter.com/J2c7ZVEUdK
— $SPONGE (@spongeoneth) September 23, 2024
Join the SPONGE community and be part of the next big crypto sensation! Buy Sponge ($SPONGE) today!