BNB (BNB/USDT) Surges and Potential Market Roadblocks
Estimated Reading Time: 3 minutes
Don’t invest unless you’re prepared to lose all the money you invest. This is a high-risk investment and you are unlikely to be protected if something goes wrong. Take 2 minutes to learn more
BNB against Tether has sen a sharp upward move recently, with the price climbing significantly over the past few weeks. At the moment, the current market sentiment reflects bullish structure. This is reflected in strong buying momentum, as shown by the price breaking through multiple and psychological resistance levels. However, as BNB approaches a critical area, the pair’s price is beginning to experience an urge to pull back. This reflects sell pressure after recording a new high.
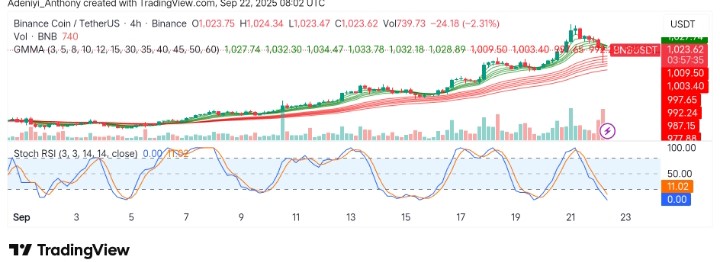
Currently, BNB trades at $1,023.80 with over 273 thousand traded volumes on the daily timeframe.

Technical Indicators
Major Resistance Levels: $1,050, $1,176, and $1,200
Major Support Levels: $990, $919, and $890
BNB Technical Analysis
BNB against Tether on the daily chart shows the pair has risen to a new high and is currently operating above $1,020 due to an increase in bullish participation. However, the overbought condition of the Stochastic RSI suggests the BNB may witness a pullback, especially if the price fails to maintain a strong hold above the immediate support level. On the contrary, the Guppy Multiple Moving Averages (GMMA) still maintains a bullish structure, indicating further upside looms if support around $900 is upheld.
Right now, as BNB approaches a key resistance, the current price action shows the coin is consolidating near its top. With the Stochastic RSI in the overbought region, there is a possibility of a short-term pullback or consolidation before a continuation higher.
What’s Next for BNBUSDT?
Currently, BNB has outperformed the Bitcoin cycle, grinding higher after hitting above the $1,000 psychological level. Now, it appears the coin is already developing a fifth wave to the north. As it stands, the support on the shorter timeframe lies at $919, showing a recent gap, and if the pullback at the fourth wave holds above this level, the coin may experience further upside.
BNBUSDT Analysis: What to Expect
In the 4-hour chart, BNB shows signs of short-term consolidation. The price is currently testing resistance levels while the Stochastic RSI is dipping into the lower range, suggesting the pair may possibly correction temporarily. After reaching the $1,023 mark, the volume seems to be reducing, suggesting increasing selling pressure amidst range-bound movement.
As it stands, this could be a brief consolidation period before another attempt to the north. To this end, if the current trade closes above $1,003, the oversold condition of the Stochastic RSI may trigger another gain. Conversely, a break below this level could pull the pair’s price towards $997.
You can purchase crypto coins here. Buy Crypto