BNB (BNB/USDT) Bullish Run: Is It Time for a Break or Further Momentum?
Estimated Reading Time: 3 minutes
Don’t invest unless you’re prepared to lose all the money you invest. This is a high-risk investment and you are unlikely to be protected if something goes wrong. Take 2 minutes to learn more
BNB against Tether for a long period of time has enjoyed a smooth transition to the north this year. With recent price action above key moving averages and an overall increase in volume, investors remain confident in the continued strength of BNB.
Recently, the pair is in a severe face-off against a critical resistance around $944, and despite some recent corrections, the overall trend suggests further growth potential. As it stands, recent candlestick formation shows bullish exhaustion, and prolonged sell pressure may change the course of things.
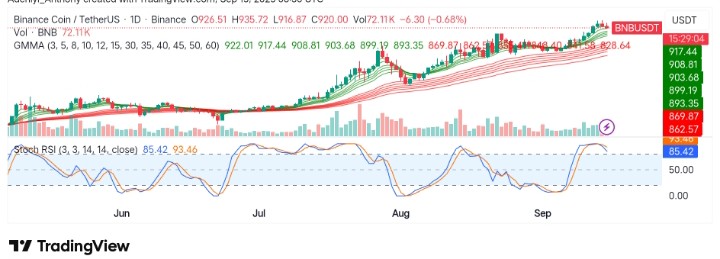
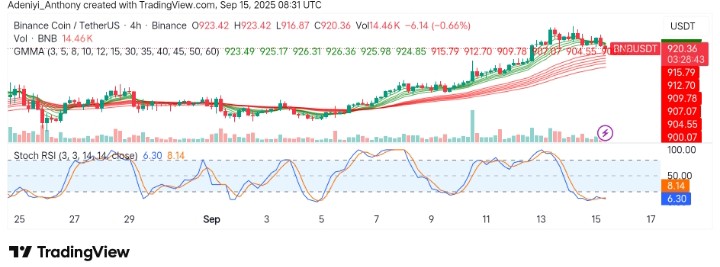
Currently, BNB trades at $920 with over 72 thousand traded volumes at the beginning of the week.
Technical Indicators
Major Resistance Levels: $926.51, $935.72, and $950.00
Major Support Levels: $915.00, $893.00, and $850.00
BNBUSDT Technical Analysis
Technically, BNB has seen a large bullish momentum in recent times. However, the recent formation of a bearish pattern after the bullish rally suggests that buying pressure is waning and a potential breakdown may be near.
On one side of the analysis, the Guppy Multiple Moving Averages (GMMA) show a strong bullish signal as the shorter-term moving averages are well above the longer-term moving averages, indicating a healthy uptrend.
From another angle, the Stochastic RSI is currently indicating the pair is overbought, and the downward curl of the lines suggests the pair may experience a pullback in the near term.
To this end, BNB hangs on a thread; failure to hold above $914 may attract further downside towards $890; otherwise, the previous trend continues.
$BNB
The price has reached my target zone for this cycle. However, I would see a move up to $1180-$1580 as ideal. https://t.co/wZ2vF5RXAL pic.twitter.com/XDU0TBExRm— More Crypto Online (@Morecryptoonl) September 13, 2025
Meanwhile, @Morecryptoonline in a post on X (formerly Twitter) believes BNB against Tether has one more cycle towards $1,180 or $1,580 after reflecting on the Jan 29 price prediction using the Elliot wave indicator.
BNBUSDT Short-term Analysis: A Pullback or Setup for a Breakout?
On the 4-hour chart, BNB/USDT is experiencing a slight correction after failing to break above immediate resistance at its recent high. Now the pair’s value is currently hovering around $920.36. Though the GMMA still indicates a bullish structure, the Stochastic RSI operates deeply in the oversold region, adding to the complexity of the analysis.
As it stands, the support at $909 is still holding, and a move back to $928 would reignite bullishness, while a break below $909 will indicate further correction.
You can purchase crypto coins here. Buy Crypto