Compound (COMPUSD) Flips Bearish As The Price Fails To Form A Higher High
Estimated Reading Time: 2 minutes
Don’t invest unless you’re prepared to lose all the money you invest. This is a high-risk investment and you are unlikely to be protected if something goes wrong. Take 2 minutes to learn more

COMPUSD Analysis: Market Flips Bearish As The Price Fails To Form A Higher High
COMPUSD flips bearish as the price fails to form a higher high. After the formation of a lower high at $79.60, the bears kept pushing prices lower. Following the previous expansion of price in fractals to the upside, the price entered an overbought state. As a result of the indication by the RSI (Relative Strength Index), the bulls exited the market.
COMPUSD Significant Zones
Demand Zones: $48.70, $23.20
Supply Zones: $75.20, $93.40

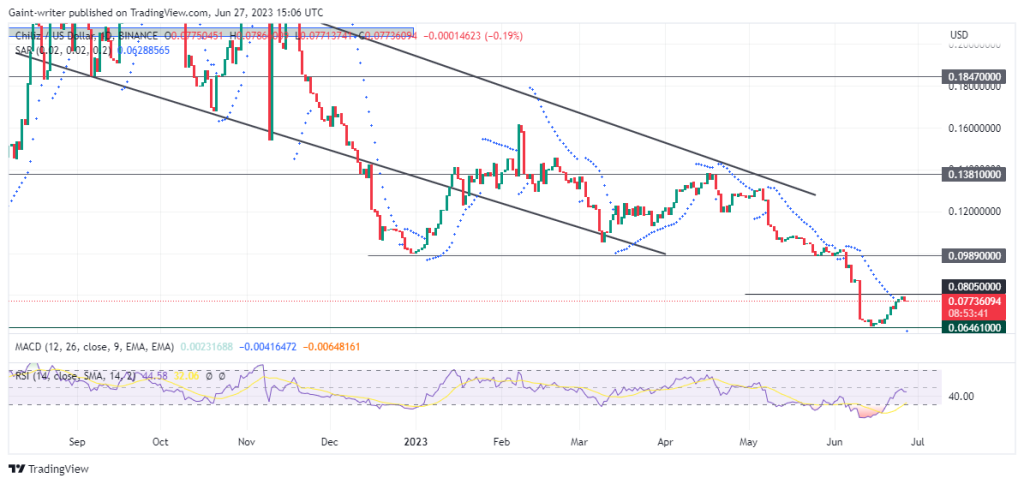
Since the formation of the swing high in February 2023, the market has crashed downward. Owing to the fall, support levels were invalidated as the price continued slowly to the downside. As the bearish trend ended, the market’s decline was energized by emerging diagonal resistance. However, the diagonal resistance was broken as the price flipped bullish in June 2023. The bullish move was initiated by the bulls at 23.20. Coupled with the indication of the RSI, more COMPUSD had to exit the market.
Further expansion to the upside occurred until a new swing high formed around the $70.00 psychological level. However, COMPUSD retraced into a daily bullish order block, which propelled prices to the upside. The uptrend continued until a long-term high formed at $86.00; this marked the beginning of the ongoing bearish trend. A Fair Value Gap formed as the price crashed to the downside after a failed swing formation. The Fair Value Gap is likely to cause a resumption of the downtrend should the price retrace upward from an oversold region.

Market Expectation
On the four-hour chart, a BOS (Break Of Structure) has occurred to the downside. The BOS occurred as the price crashed from the $75.20 resistance, thereby strengthening the bearish trend. However, following the BOS, COMPUSD is likely to make an upward correction once the $48.70 support is hit.
You can purchase Lucky Block here. Buy LBLOCK
Note: Cryptosignals.org is not a financial advisor. Do your research before investing your funds in any financial asset or presented product or event. We are not responsible for your investing results.