Bitcoin (BTC/USD) Goes a Bit Under Pressure in the Correctional Move as Price Tests Support at $55,000 Level
Estimated Reading Time: 3 minutes
Don’t invest unless you’re prepared to lose all the money you invest. This is a high-risk investment and you are unlikely to be protected if something goes wrong. Take 2 minutes to learn more
Bitcoin Price Prediction – April 18
The market worth of BTC/USD instrument now moves further under a slight pressure possibly in the wake of trying to locate other lower base-line support to re-launch a pull-up price move.
BTC/USD Market
Key Levels:
Resistance levels: $65,000, $70,000, $75,000,
Support levels: $50,000, $45,000, $40,000
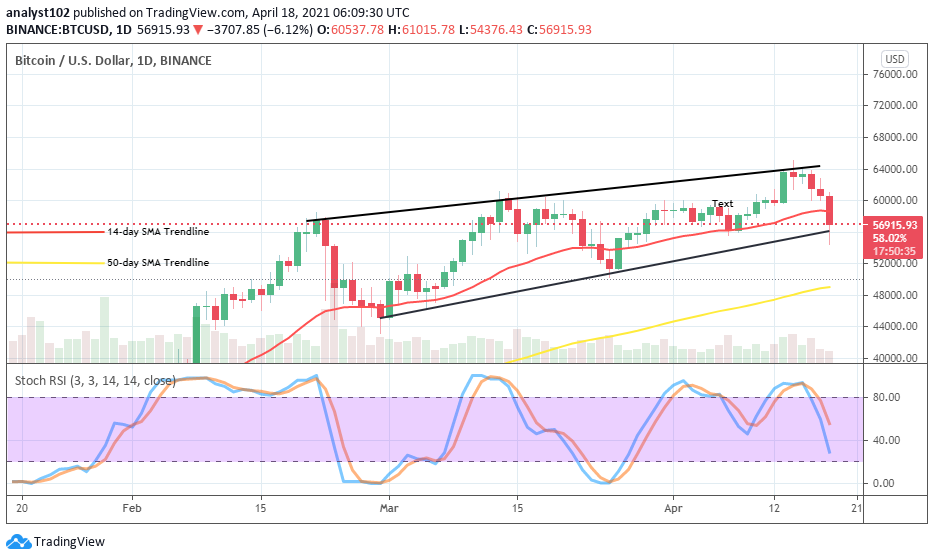
BTC/USD – Daily Chart
The BTC/USD daily trading chart now gives back the bullish formation channels within which the crypto’s value has been adjudged in its effort of moving northbound. As it is shown currently, the lower channel line has been briefly traded past to the south at $55,000 level. But, presently, price now trades around the $57,500 zone. The 14-day SMA trend-line and the bullish trend-line drawn in support have been breached downward. The 50-day SMA still stays far below them closely below the point of $50,000. The Stochastic Oscillators have crossed from the overbought region to point to the south at range 40. That signifies that some falling pressures are yet to be exhausted.
Will the BTC/USD current downward pressure be extended to a lower level of $50,000?
Indication has had it that some degrees of falling pressures have taken a center stage currently in this crypto-economy activity. The BTC/USD bulls have appeared to relax in their pushing efforts over a couple of days’ sessions. However, all hope is not lost; as the price has got drawn down to touch a support area of the lower bullish trend-line of around $55,000. Therefore, it could be one of the necessary testing points for the bulls to rebuild their stance in the market.
As regards the downside, the bears in this crypto-market will have to intensify more efforts to push past below the $55,000 lower bullish channel-line for a touch of another lower price value of $50,000. In the meantime, the falling pressure is still in play as of writing. But, bears will have to take to precautionary principle guiding against late entry in this market to avoid being getting trapped.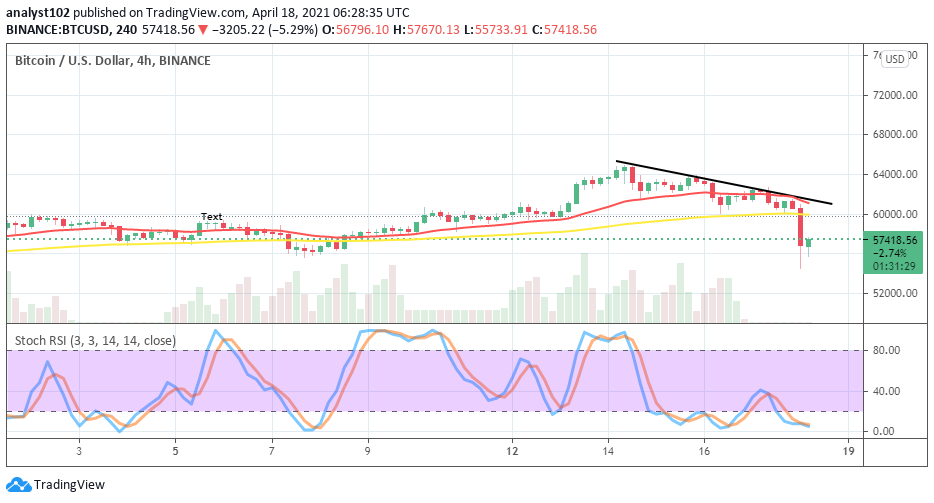
BTC/USD 4-hour Chart
In the medium-term run, the BTC/USD 4-hour chart has clearly shown that the crypto’s value has at last goes dumped to suggest the presence of a bearish trend. There has been an emergence of a 4-hour bearish candlestick breaking through the two SMAs to the south. The 14-day SMA trend-line is slightly pointing to the south close above the 50-day SMA trend-line. The Stochastic Oscillators have dipped into the oversold region to close the hairs in it. They now signify a less-active move in the current downward pressures.
Note: cryptosignals.org is not a financial advisor. Do your research before investing your funds in any financial asset or presented product or event. We are not responsible for your investing results.