XRP (XRP/USDT) Shows Recovery Sign Amidst Market Pullback
Estimated Reading Time: 3 minutes
Don’t invest unless you’re prepared to lose all the money you invest. This is a high-risk investment and you are unlikely to be protected if something goes wrong. Take 2 minutes to learn more
In the last 24 hours, XRP against Tether is underperforming the broader digital asset market, falling by 1.16% amid profit-taking activities in the market, a technical breakdown below $2.4100 support in the previous trade, and an increasing fear indicator.
At the moment, the pair seems to be enjoying bullish pressure with some improvement above the $2.4100 support level. However, recent price movement shows a negative value of 3.07% below the previous day’s closing price. Meanwhile, the Guppy Multiple Moving Averages (GMMA) and the Stochastic suggest the pair is about to make a U-turn to the north.
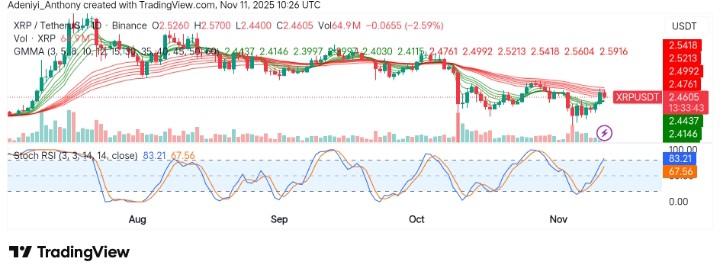
Currently, XRP trades at $2.4605 with more than 69 million traded volumes for the day.
Technical Indicators
Major Resistance Levels: $2.5700, $2.6000, and $3.0000
Major Support Levels: $2.4400, $2.4115, and $2.4000
Technical Analysis
Technically, XRP against Tether seems to be showing an early recovery pattern after a recent minor pullback, reclaiming lost gains. The GMMA on the daily chart appears to be reflecting a bullish momentum with short-period EMAs converging to the long-period EMAs.
Additionally, the Stochastic RSI now operates in the overbought region, denoting the pair is gaining more bullish interest. However, more is needed for confirmation, as the $2.5700 remains untouched.
To this end, bullish interest needs to improve for an eventual move into the $3.000 zone; otherwise, range-bound activity may begin.
$XRP pic.twitter.com/OkEz7NbmP1
— BennY CryptO (@SilverTrade111) November 11, 2025
At the moment, @SilverTrader111 on XRP has posted a chart, implying the token is about to potentially move to the north in the coming session, judging from the pattern of the momentum oscillator.
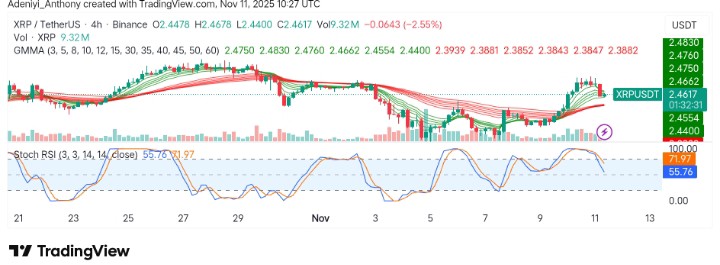
XRP/USDT Analysis: Facing Short-Term Consolidation: What’s Next?
On the 4-hour chart, XRP/USDT is currently ranging between $2.4400 and $2.4700; as it stands, the price seems to be enjoying the bullish push. However, the curvature of the short-period EMAs suggests the bears are really fighting back as the Stochastic RSI tends south.
To this end, XRP/USDT appears to be waiting for a strong catalyst to move either way, and the next short-period resistance is at $2.4800; momentum may start to decrease if the level is not cleared.
You can purchase crypto coins here. Buy Crypto