Cardano Falls Significantly and May Reverse at $0.23
Estimated Reading Time: 2 minutes
Don’t invest unless you’re prepared to lose all the money you invest. This is a high-risk investment and you are unlikely to be protected if something goes wrong. Take 2 minutes to learn more
Cardano (ADA) Price Long-Term Forecast: Bearish
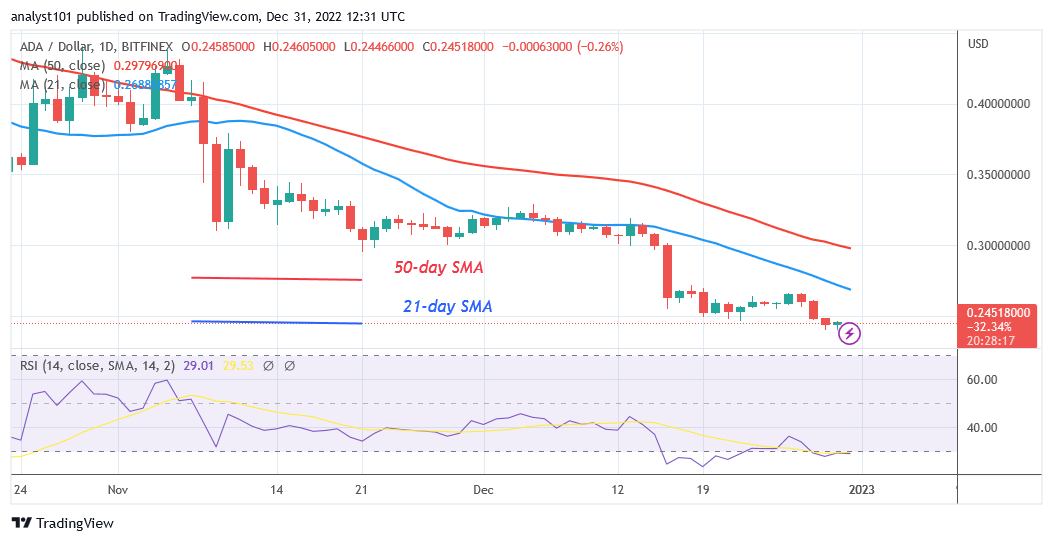
Cardano’s (ADA) price gets closer to the lowest price point as it may reverse at $0.23. The level of bearishness in the market has peaked. Sellers broke the $0.25 support today as the price dropped to a low of $0.24. The asset’s current price in cryptocurrencies is $0.24. The price will therefore remain negative until it reaches a low of $0.23 or $0.18. On the other hand, ADA will cross through the moving average lines if it rises over the $0.25 support level. There will be positive momentum until the previous highs of $0.35 and $0.40. Due to the current selling pressure, the oversold area of the market is apparent.
Cardano (ADA) Indicator Analysis
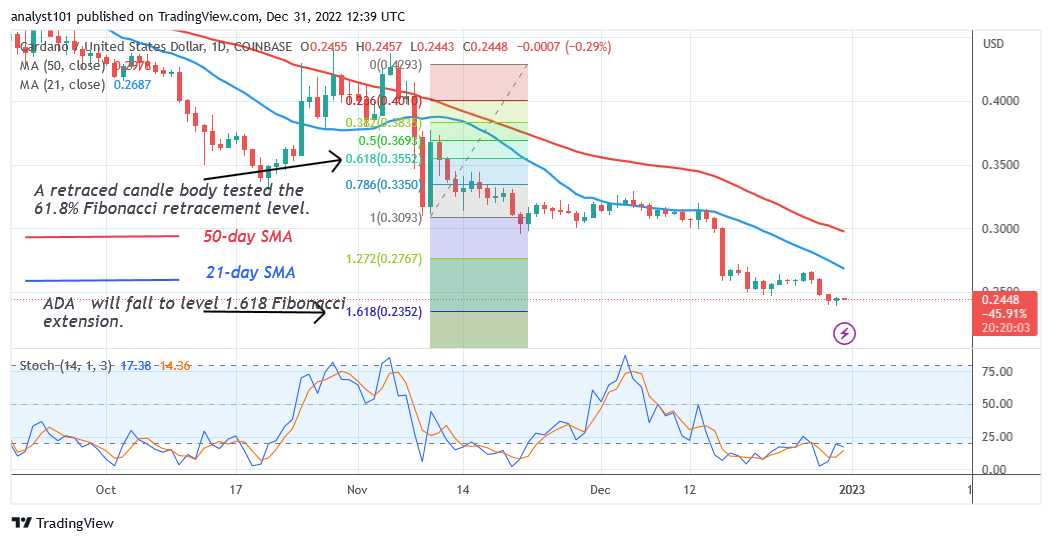
According to the Relative Strength Index, Cardano is currently at level 29. This signals that the market is currently oversold. Given that the market is oversold, less selling pressure is anticipated. The price of the altcoin is being pushed lower since the moving average lines are above the price bars. ADA is oversold as a result of the daily Stochastic being below level 20.
Technical indicators:
Major supply zones: $1.0, $1..05, $1.10
Major demand zones: $0.45, $0.40, $0.35
What Is the Next Move for Cardano (ADA)?
Cardano is on a downward trend as it may reverse at $0.23. The price indicator predicts that Cardano will fall to the $0.23 low or level 1.618 of the Fibonacci extension. The oversold area of the market is where the cryptocurrency has sunk.
You can purchase crypto coins here. Buy LBLOCK
Note: Cryptosignals.org is not a financial advisor. Do your research before investing your funds in any financial asset or presented product or event. We are not responsible for your investing results