Litecoin (LTC/USD) Price Encounters Rejections
Estimated Reading Time: 3 minutes
Don’t invest unless you’re prepared to lose all the money you invest. This is a high-risk investment and you are unlikely to be protected if something goes wrong. Take 2 minutes to learn more
Litecoin Price Prediction – October 12
The LTC/USD price encounters rejections at different closer locations beneath the resistance level of $200. Currently, the crypto-economic price trades around $170 at a negative average percentage rate of about 4.90. That’s an indication that the market is getting set to downsize in no time.
LTC/USD Market
Key Levels:
Resistance levels: $200, $240, $280
Support levels: $140, $120, $100
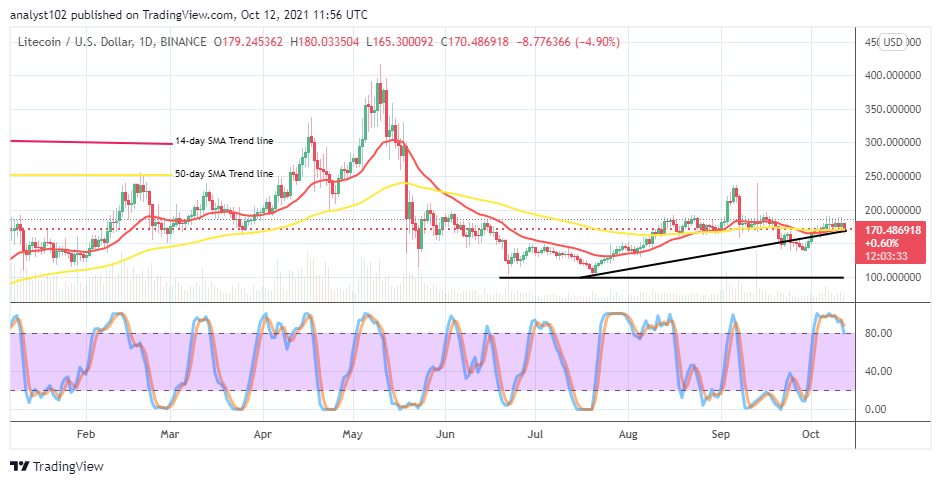
LTC/USD – Daily Chart
The LTC/USD daily chart reveals that the crypto-economic price encounters rejections closely underneath the resistance level at $200. All the indicators are in a conjoined formation. The 14-day SMA trend line moved southward slightly above the 50-day SMA trend line. And the bullish trend line drew to serve as a support to them. The Stochastic Oscillators have briefly crossed southward from the overbought region, suggesting the possibility of getting to a downward force in no time.
Will the LTC/USD market slide for a long time as price encounters rejections closely underneath the $200 resistance level?
Indications suggest the LTC/USD market downturn as the crypto-economic price encounters rejections closely underneath the $200 resistance level. However, there can be a sudden return of rebounding movement while the market pushes the downside toward the $140 support level. Similarly, the price may in the near time change positively against the point earlier mentioned. An abrupt downward movement will once again provide re-investment trading plans for intending investors. Also, long position takers will be taking advantage to reload their positions.
On the downside, the LTC/USD market bears have to be wary of the $200 resistance line as its breaking to the north side may lead the market into witnessing, breaking through variant higher resistances. Either testing or a reversal around the value line will portend a good omen into pacing a sell position. Presently, short-position takers would need to be on the lookout for a price rejection around that line to detect a sell entry.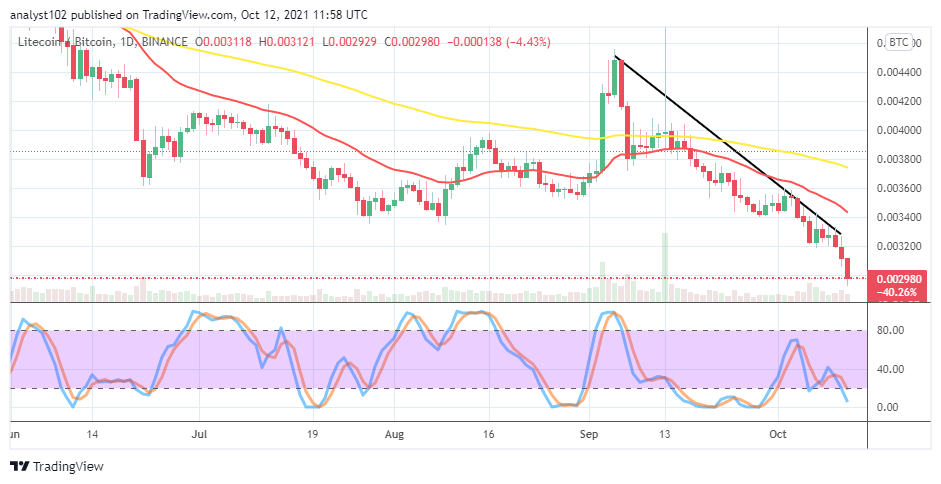
LTC/BTC Price Analysis
In comparison, it is depicted on the price analysis chart that Litecoin market operation experiences a degree of depressions trading against Bitcoin. It recorded that the cryptocurrency pair price encounters no rejections. The counter crypto has been trending against the base crypto on a higher moving note. The 14-day SMA is underneath the 50-day SMA with a space featuring between them. The bearish trend line drew southward across the SMAs, showing the market’s path to the downside. The Stochastic Oscillators are attempting to move into the oversold region. It still appears that LTC will go down more as paired with BTC.
Note: Cryptosignals.org is not a financial advisor. Do your research before investing your funds in any financial asset or presented product or event. We are not responsible for your investing results.
You can purchase crypto coins here. Buy Tokens