Tamadoge (TAMA/USD) Price Update: $0.00021 Emerges as a Potential Rebound Zone
Estimated Reading Time: 3 minutes
Don’t invest unless you’re prepared to lose all the money you invest. This is a high-risk investment and you are unlikely to be protected if something goes wrong. Take 2 minutes to learn more
The Tamadoge (TAMA/USD) market recently defied expectations by breaking below the key $0.00027 support level, where it had previously been consolidating. This breakdown triggered additional bearish sentiment, accelerating the decline and pushing the price below $0.00025—eventually sending it toward the $0.00020 region.
Despite the downturn, current chart readings reveal emerging bullish interest near the $0.00021 mark, suggesting a potential bounce point. If buying pressure continues to build at this level, TAMA may be poised for a short-term reversal or stabilization, offering a possible setup for bullish reentry.
Traders should watch this zone closely for signs of a shift in market sentiment.
Key Levels to Watch
- Resistance Zones: $0.00045, $0.00050, $0.00055
- Support Zones: $0.00020, $0.00019, $0.00018
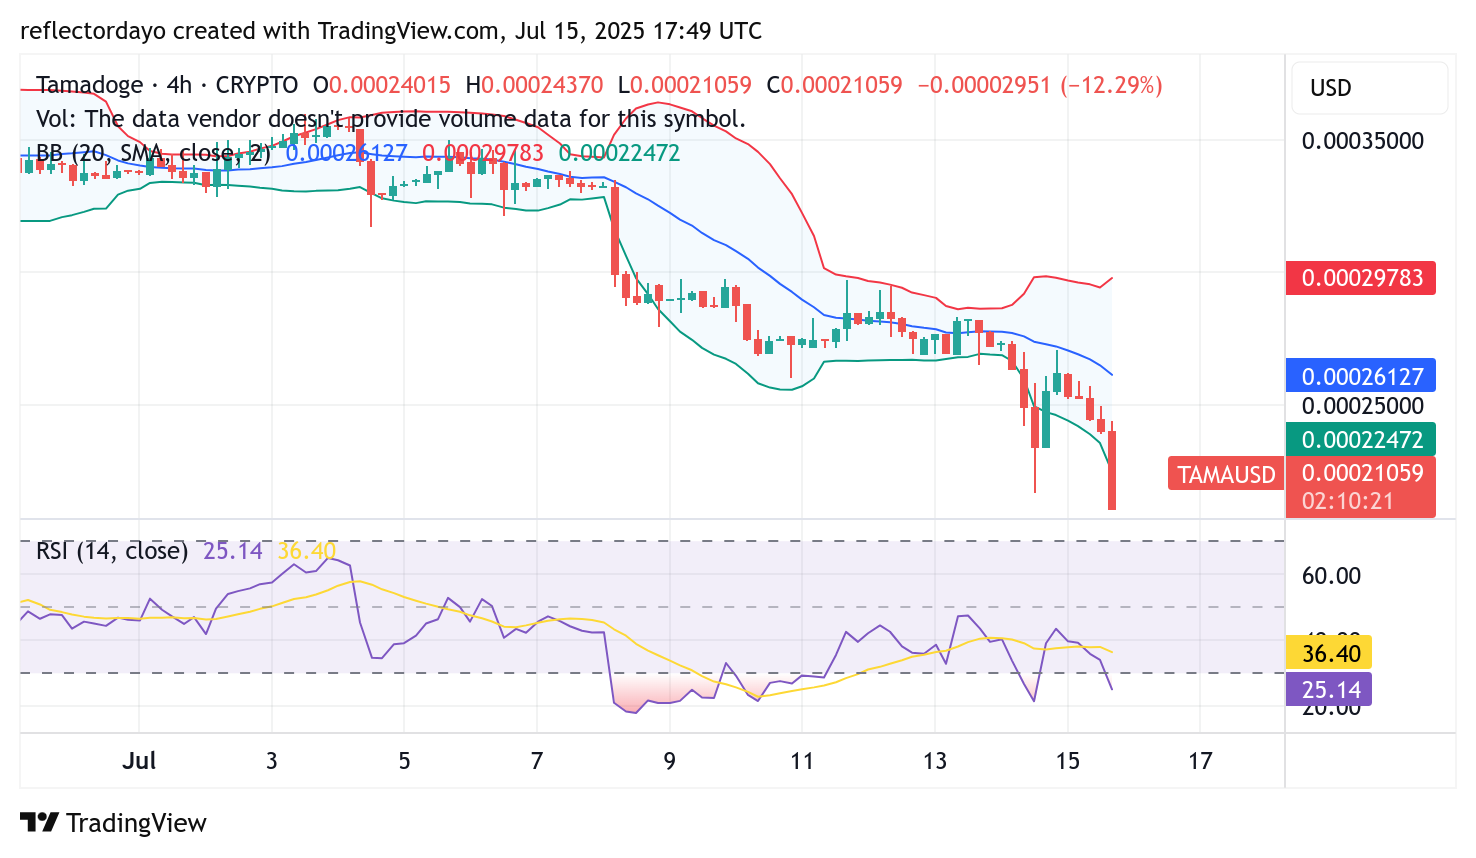
Tamadoge 4-Hour Chart: Technical Indicators Signal a Potential Reversal
The Tamadoge (TAMA/USD) market is showing signs of bullish interest around the $0.00021 and $0.00020 price levels. In a previous trading session, a rejection at the $0.000216 level briefly reversed the downward trend, suggesting that buyers are beginning to step in at lower price zones.
However, the current session remains under intense bearish pressure, driving the price lower in a continued push for fresh lows. Despite this, key technical indicators are now pointing to a potential shift.
The Bollinger Bands are expanding, with price action hugging the lower band, while the Relative Strength Index (RSI) is dipping deeper into oversold territory—classic signs that bearish momentum may be waning.
If this exhaustion materializes, a rebound could be imminent, potentially gaining strength as bulls take advantage of elevated volatility to stage a recovery. Traders should watch closely for confirmation of a reversal before positioning for a potential bounce.
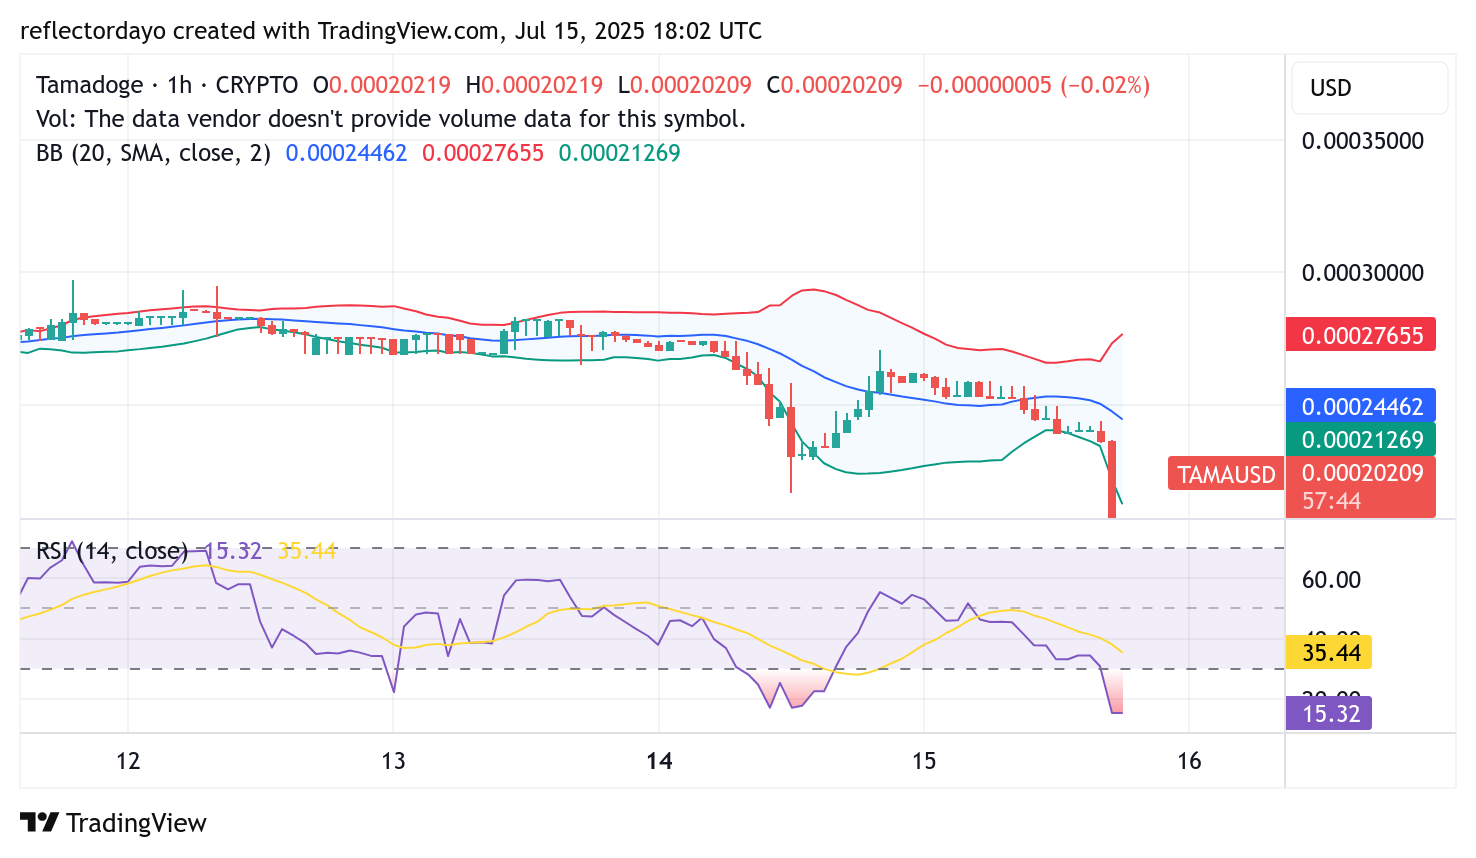
TAMA/USD 1-Hour Chart: Signs of Accumulation Amid Bearish Pressure
The bearish momentum seen on the 4-hour chart is further confirmed on the 1-hour timeframe, where the Tamadoge (TAMA/USD) market continues to face intense selling pressure. However, current technical indicators suggest that bearish momentum may be nearing exhaustion.
The Bollinger Bands reveal heightened downside volatility, with price action hugging the lower band—often a sign that the market is oversold. Additionally, the Relative Strength Index (RSI) has dropped sharply to level 15, reinforcing the view that selling may be overextended.
With the price now approaching the critical $0.00020 support zone, a potential rebound could be in play. If bullish sentiment strengthens at this level, the market may attempt a recovery toward the $0.00027 resistance area.
Traders should monitor this phase closely, as signs of accumulation could mark the beginning of a shift in momentum.
Buy Tamadoge!
There’s no mobile runner out there quite like #TamadogePursuit! 🏃♂️
1️⃣ Sign up – start with 20 free credits for a boost!
2️⃣ Climb up the leaderboards.
3️⃣ Win $TAMA rewards!Play Now! 👇
📱Android: https://t.co/Of8SYALRzL
📱 iOS: https://t.co/IthvqovwAH pic.twitter.com/84HNqob9Rf— TAMADOGE (@Tamadogecoin) September 10, 2024