Tamadoge (TAMA/USD) Finds Footing at $0.00027—Rebound in Sight?
Estimated Reading Time: 3 minutes
Don’t invest unless you’re prepared to lose all the money you invest. This is a high-risk investment and you are unlikely to be protected if something goes wrong. Take 2 minutes to learn more
The Tamadoge (TAMA/USD) market remains at a critical crossroads following its decline from the $0.00035 level and the emergence of renewed buying interest around the $0.00027 support zone. Over the past few days, bearish sentiment has dominated, clearly reflected in both price action and technical indicators.
However, the market is currently in a state of consolidation, as bullish interest at the $0.00027 level appears to be slowing the downward momentum. This standoff suggests a temporary equilibrium between buyers and sellers.
A breakout above the current range could spark a short-term bullish recovery. Conversely, failure to hold above $0.00027 may open the door to further downside pressure and potentially deeper losses.
Key Levels to Watch
- Resistance Zones: $0.00045, $0.00050, $0.00055
- Support Zones: $0.00027, $0.00026, $0.00025
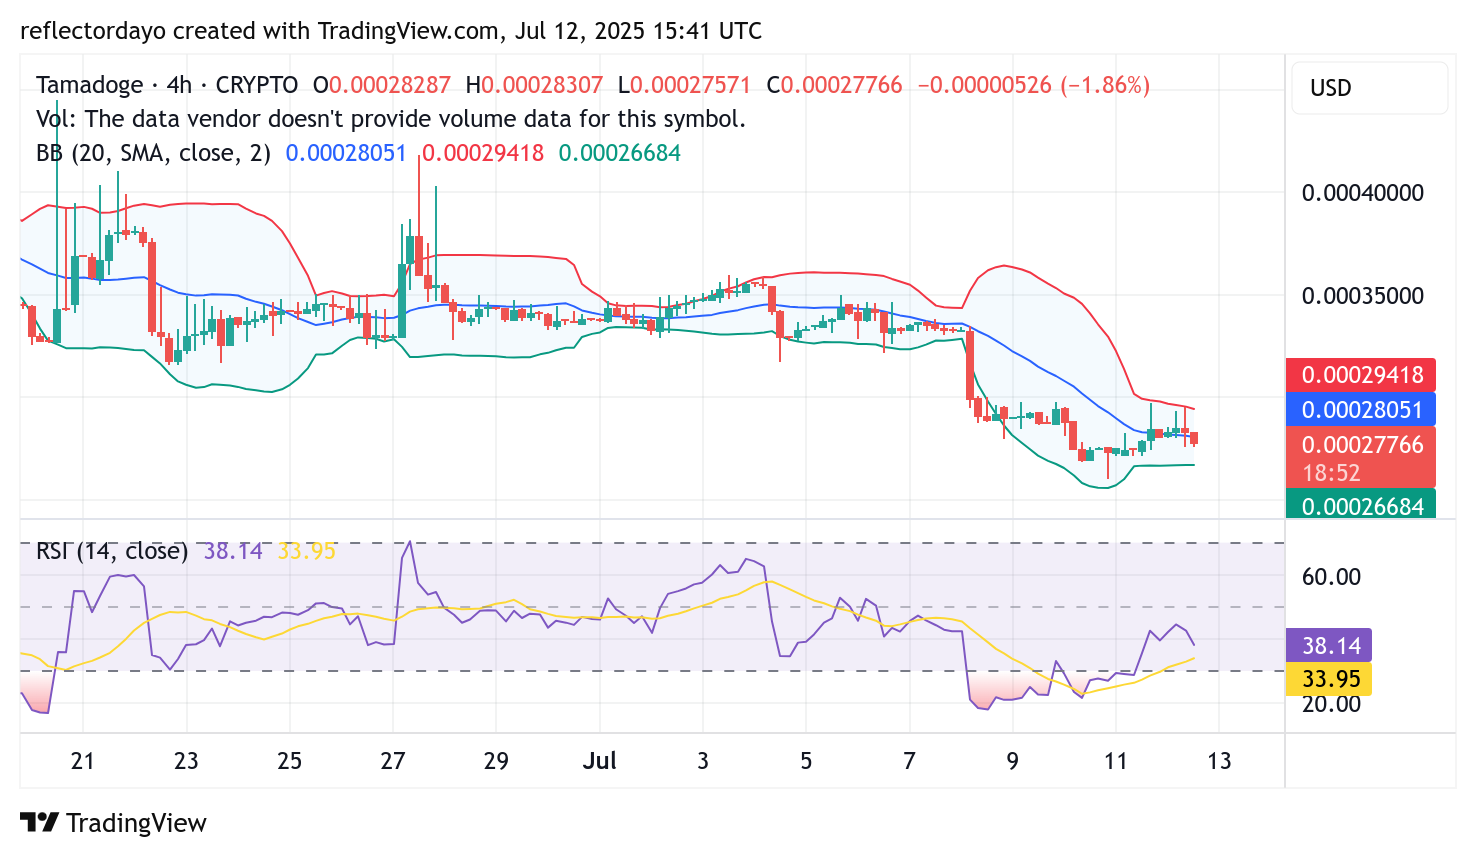
Tamadoge 4-Hour Chart: Indicators Hint at a Possible Reversal
The 4-hour chart and accompanying indicators reflect a period marked by strong bearish activity in recent Tamadoge trading sessions. However, this downward pressure has been met with intermittent bullish responses, creating a clash of opposing market sentiments and leading to increased volatility.
Currently, the crypto signal remains in consolidation around the $0.00027 level. Following the initial faceoff, volatility has notably declined, suggesting a temporary balance between buyers and sellers. This quieter phase may indicate the onset of accumulation, potentially laying the groundwork for an upward breakout. At the same time, the persistence of this consolidation suggests that bearish momentum may be gradually weakening.
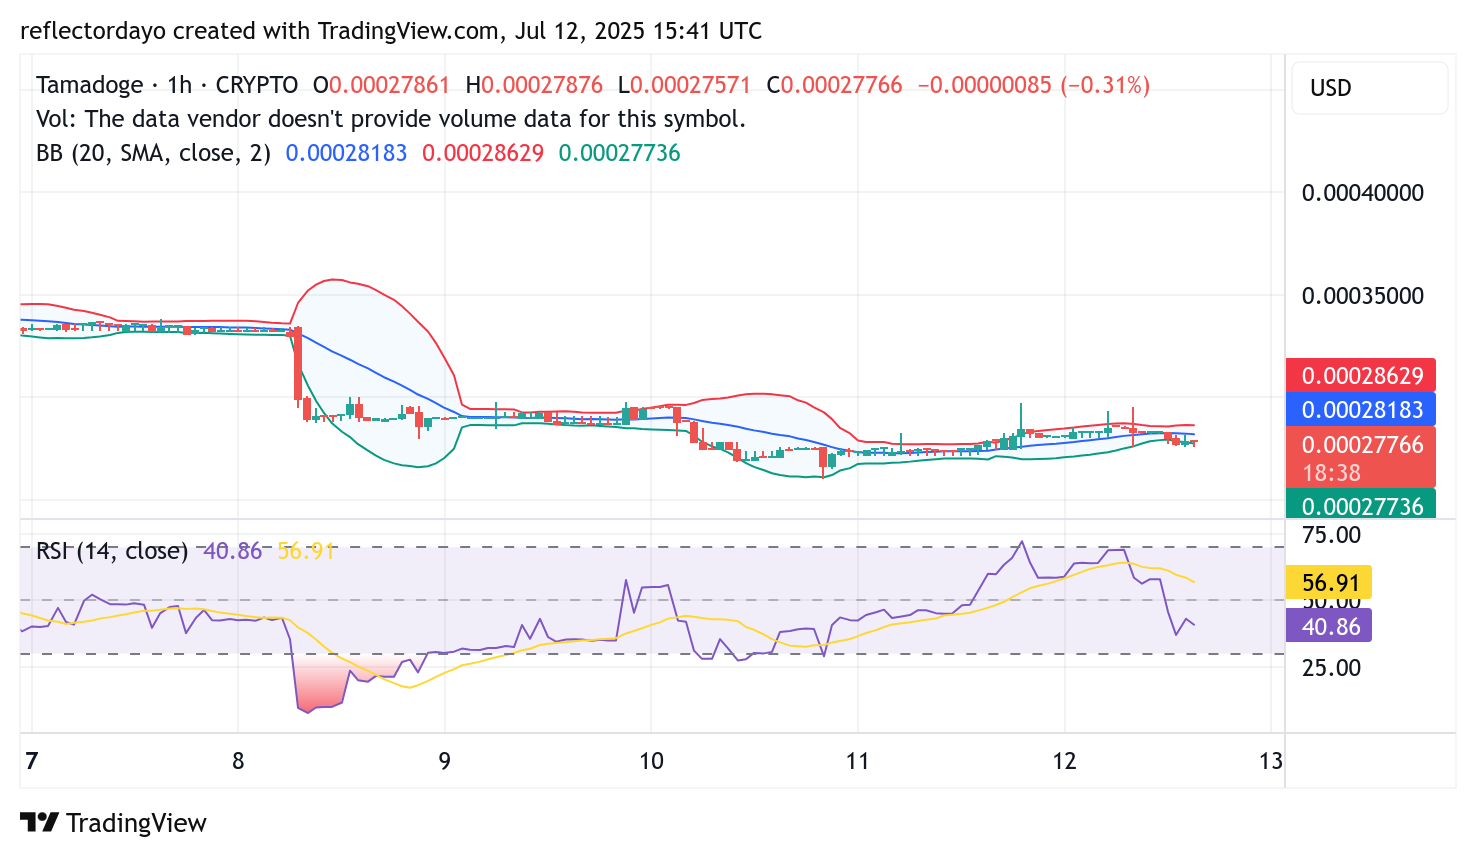
TAMA/USD 1-Hour Chart: Accumulation Phase Unfolding?
The 1-hour chart paints a picture of cautious optimism. Price action remains range-bound, with the RSI hovering just under the midpoint at 45. Although bearish sentiment hasn’t fully cleared, the consolidation pattern signals a market in waiting—potentially in the process of accumulation.
Traders will be watching closely for any decisive move from this range. A push above the current zone could ignite upside momentum, while a breakdown would reintroduce bearish control and possibly retest the $0.00026–$0.00025 support areas.
Tamadoge is currently stabilizing at a key technical juncture, with signs pointing to the potential for a near-term reversal. With oversold signals aligning and buyer activity increasing at $0.00027, momentum could soon shift. However, confirmation is needed before any sustainable bullish move can be confirmed.
Traders should remain attentive to volume spikes and RSI divergence, as these could offer early clues of a breakout—or a deeper correction.
Buy Tamadoge!
There’s no mobile runner out there quite like #TamadogePursuit! 🏃♂️
1️⃣ Sign up – start with 20 free credits for a boost!
2️⃣ Climb up the leaderboards.
3️⃣ Win $TAMA rewards!Play Now! 👇
📱Android: https://t.co/Of8SYALRzL
📱 iOS: https://t.co/IthvqovwAH pic.twitter.com/84HNqob9Rf— TAMADOGE (@Tamadogecoin) September 10, 2024