Polkadot Battles Resistance at $19, May Slide to $17 Low
Estimated Reading Time: 2 minutes
Don’t invest unless you’re prepared to lose all the money you invest. This is a high-risk investment and you are unlikely to be protected if something goes wrong. Take 2 minutes to learn more

Free Crypto Signals Channel

Polkadot (DOT) Long-Term Analysis: Bearish
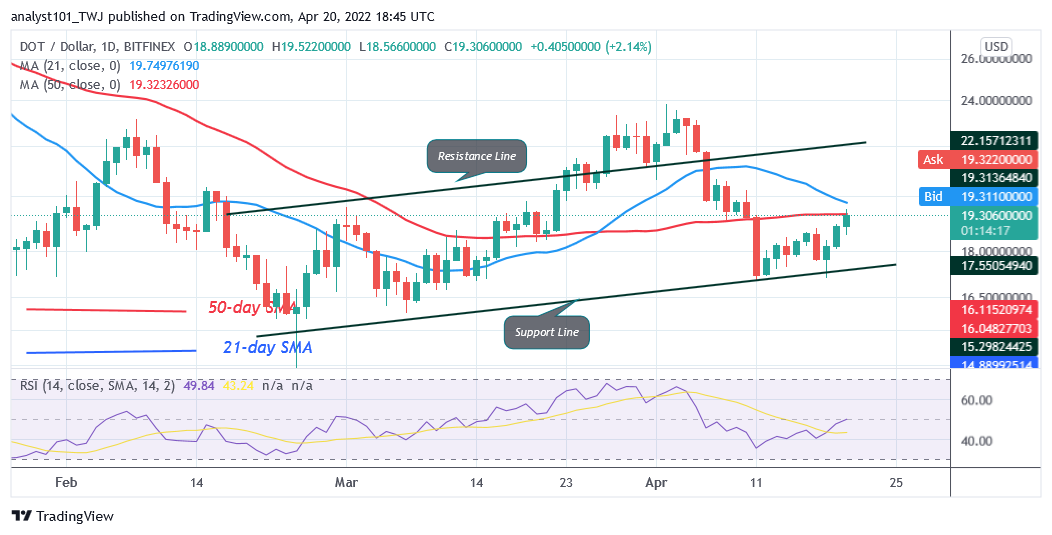
Polkadot’s (DOT) price is in a downtrend but the altcoin may slide to $17 low. Today, the DOT price is retesting the resistance at $19 to break above it. Buyers have an uphill task of breaking the resistance at $19 and $20. The altcoin will rally above the moving averages if the resistance levels are breached. The bullish momentum will extend to the high of $23. On the other hand, if the bulls breach the recent high, the altcoin will fall and be compelled to a range-bound move between the moving averages.
Polkadot (DOT) Indicator Analysis
DOT price is making positive moves to the upside. It has reached level 48 of the Relative Strength Index for period 14. The altcoin is in the downtrend zone despite the bullish move. The crypto’s price is below the moving averages, notwithstanding the current uptrend. The altcoin is above the 80% range of the daily stochastic. It indicates that the market has reached the overbought region. Further upward of the altcoin is doubtful. The 50-day line SMA and the 21-day line SMA are sloping upward indicating the uptrend.
Technical indicators:
Major Resistance Levels – $48, $52, $56
Major Support Levels – $32, $28, $24
What Is the Next Direction for Polkadot (DOT)?
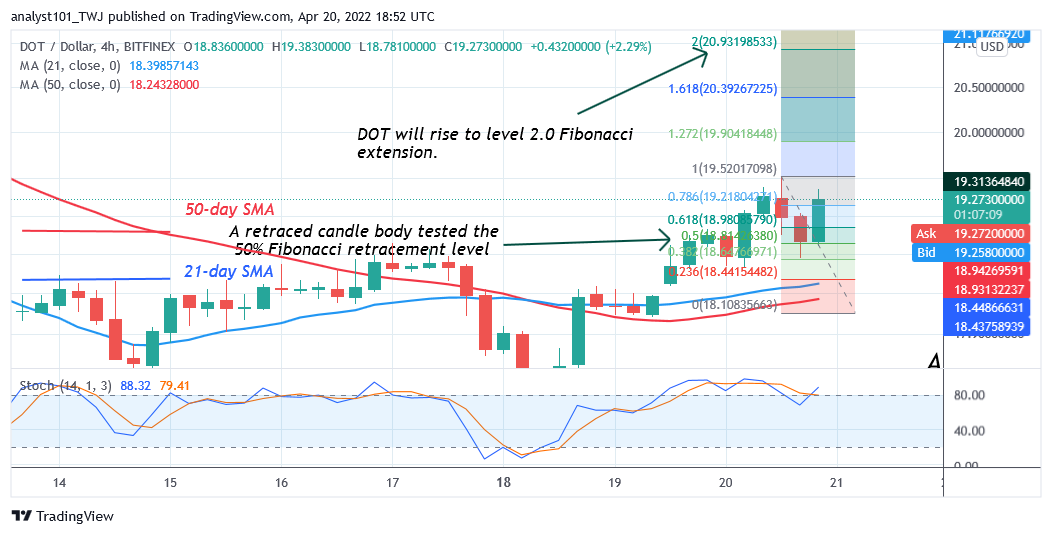
DOT/USD is in an upward move but may slide to $17 low. The uptrend is facing resistance at the high of $19. The current uptrend will resume if the resistance is breached. Meanwhile, on April 20 uptrend; a retraced candle body tested the 50% Fibonacci retracement level. The retracement suggests that DOT will rise to level 2.0 Fibonacci extension or level $20.93.
You can purchase crypto coins here. Buy LBlock
Note: Cryptosignals.org is not a 1a financial advisor. Do your research before investing your funds in any financial asset or presented product or event. We are not responsible for your investing results