Litecoin (LTC) Price Prediction: LTC/USDT Slides Below the $100.00 Price Level
Estimated Reading Time: 3 minutes
Don’t invest unless you’re prepared to lose all the money you invest. This is a high-risk investment and you are unlikely to be protected if something goes wrong. Take 2 minutes to learn more

Litecoin (LTC) Price Prediction (December 31):
The Litecoin market has been highly correlated to the Bitcoin market. Price action in the market has been under significant bearish pressure ever since the BTC market crashed below the $100,000 mark. As of the time of writing, LTC trades below the $100 price level.
LTC/USDT Long-Term Trend: Bearish (Daily Chart)
Key Price Levels:
Resistance: $100.00, $105.00, $110.00
Support: $95.00, $90.00, $85.00
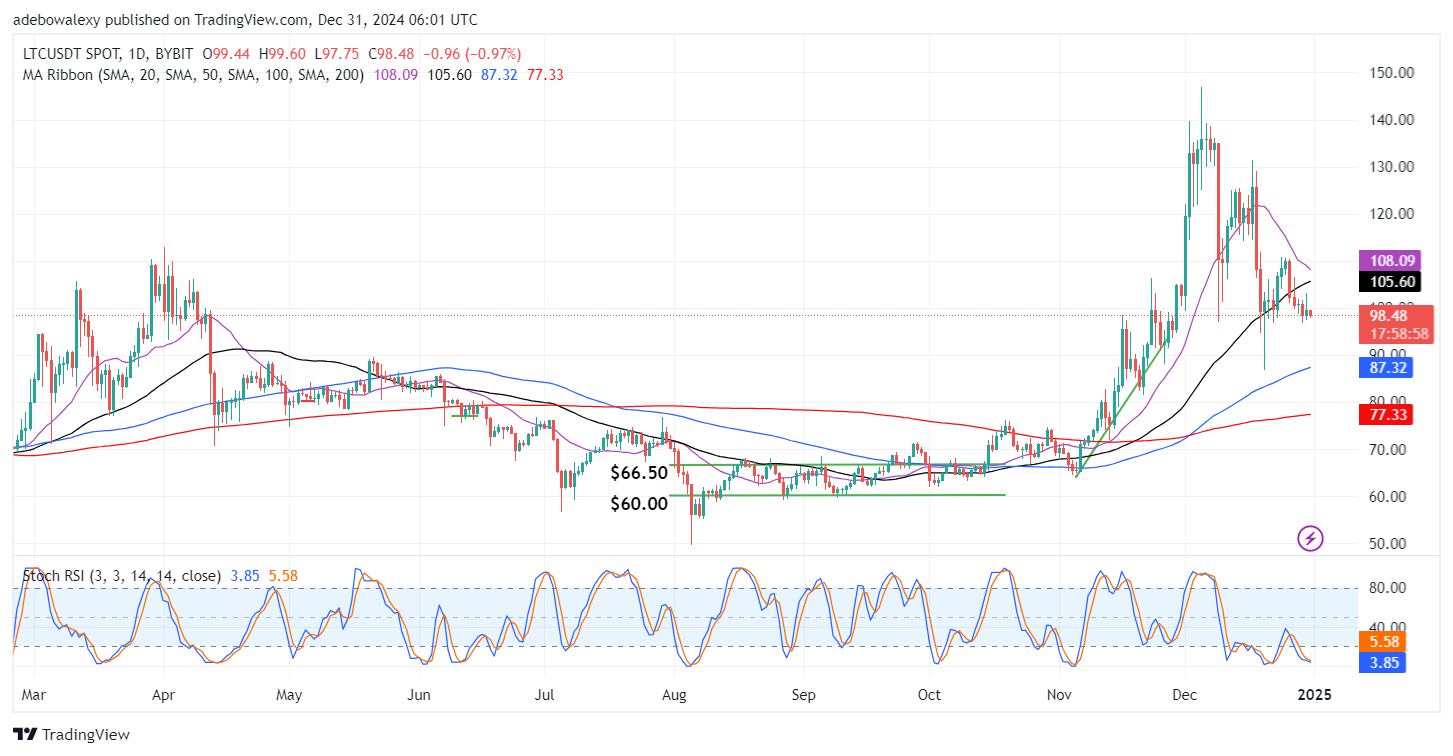
The last price candle on the Litecoin market is red, indicating some downward retracement in the market. Moreover, price activity is currently appearing below the converging 20- and 50-day Moving Averages (MA). Additionally, the Stochastic Relative Strength Index (RSI) lines are falling into the oversold region and are now below the 20 level of the indicator.
Litecoin (LTC) Price Prediction: LTC/USDT Bears Are Leading
It is clear from Litecoin’s price activity that headwinds are prevailing. The appearance of the last price candle on the chart suggests that downward forces are dominant in the session, although the downward retracement could be considered minimal. Meanwhile, the convergence of the 20- and 50-day MA lines suggests that bearish momentum may intensify subsequently.
The Stochastic RSI lines have fallen deeply into the oversold region. The endpoints of the lines are converging as they approach the lower boundary of the oversold region of the indicator. A possible bearish crossover may be anticipated, and the convergence of the MA lines above price action reinforces this bearish sentiment.
Litecoin (LTC) Price Prediction: LTC/USDT Remains Under Bearish Pressure (4-Hour Chart)
Contrary to what is observed on the Litecoin daily chart, price action here has fallen below all the MAs. The last price candle here is green but has a negligible body size. Furthermore, the Stochastic RSI lines have moved towards the oversold region of the indicator following an aborted bullish crossover.
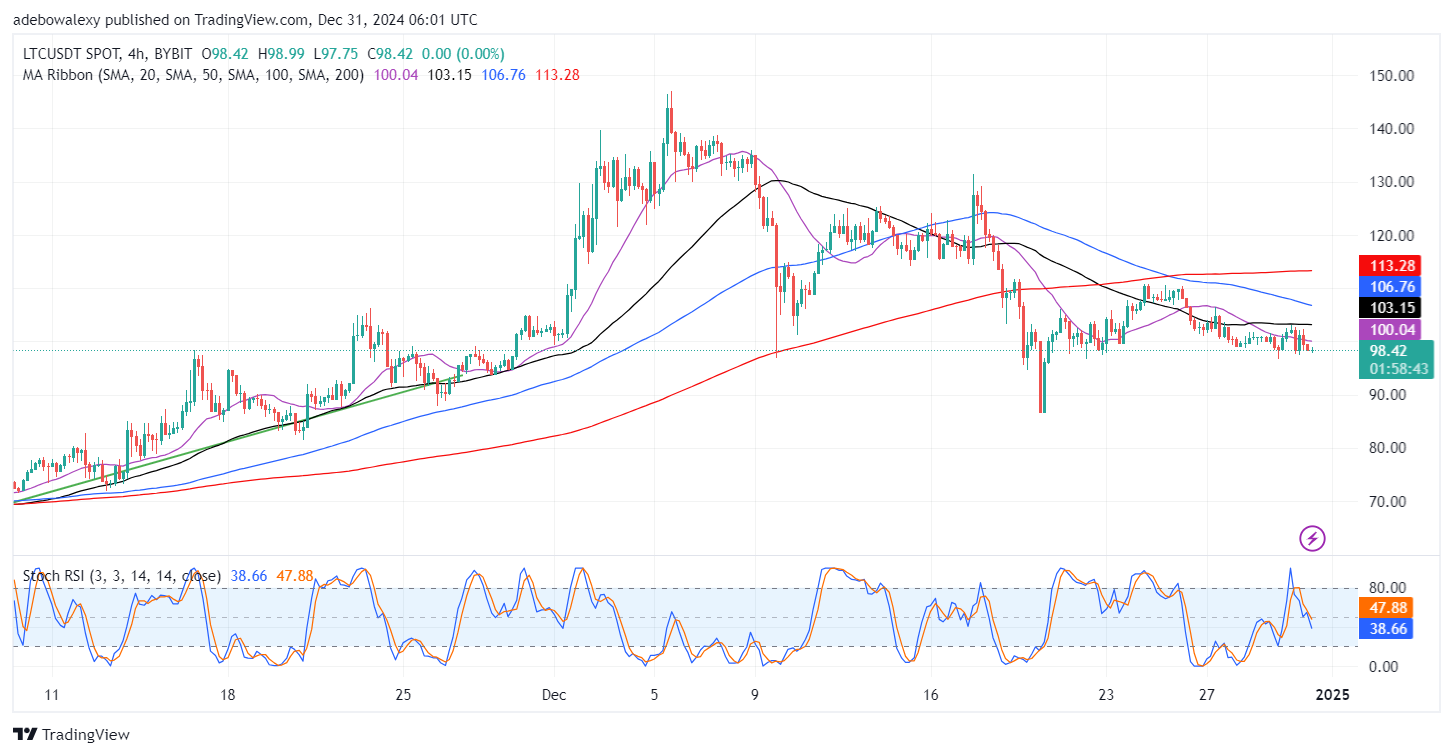
The negligible size of the last price candle on this chart reinforces the impression that price action is under a strong bearish influence. As a result, this has caused the market to contract in the session. Likewise, the downward trajectory of the RSI lines also indicates that bearish forces are likely to maintain dominance. Therefore, traders can target the $95.00 price level as a potential support level.