Dogecoin (DOGE) Price Prediction: DOGE/USDT Maintains Support Above the $0.3000 Price Level
Estimated Reading Time: 3 minutes
Don’t invest unless you’re prepared to lose all the money you invest. This is a high-risk investment and you are unlikely to be protected if something goes wrong. Take 2 minutes to learn more

Dogecoin (DOGE) Price Prediction (December 30):
Technically, the Dogecoin market has found higher support at the $0.3000 price level. This is because price activity has been oscillating above this price region for more than a week. Therefore, it appears that the market may be taking off from that support level subsequently.
DOGE/USDT Long-Term Trend: Bearish (Daily Chart)
Key Price Levels:
Resistance: $0.4000, $0.4500, $0.5000
Support: $0.3000, $0.2500, $0.2000
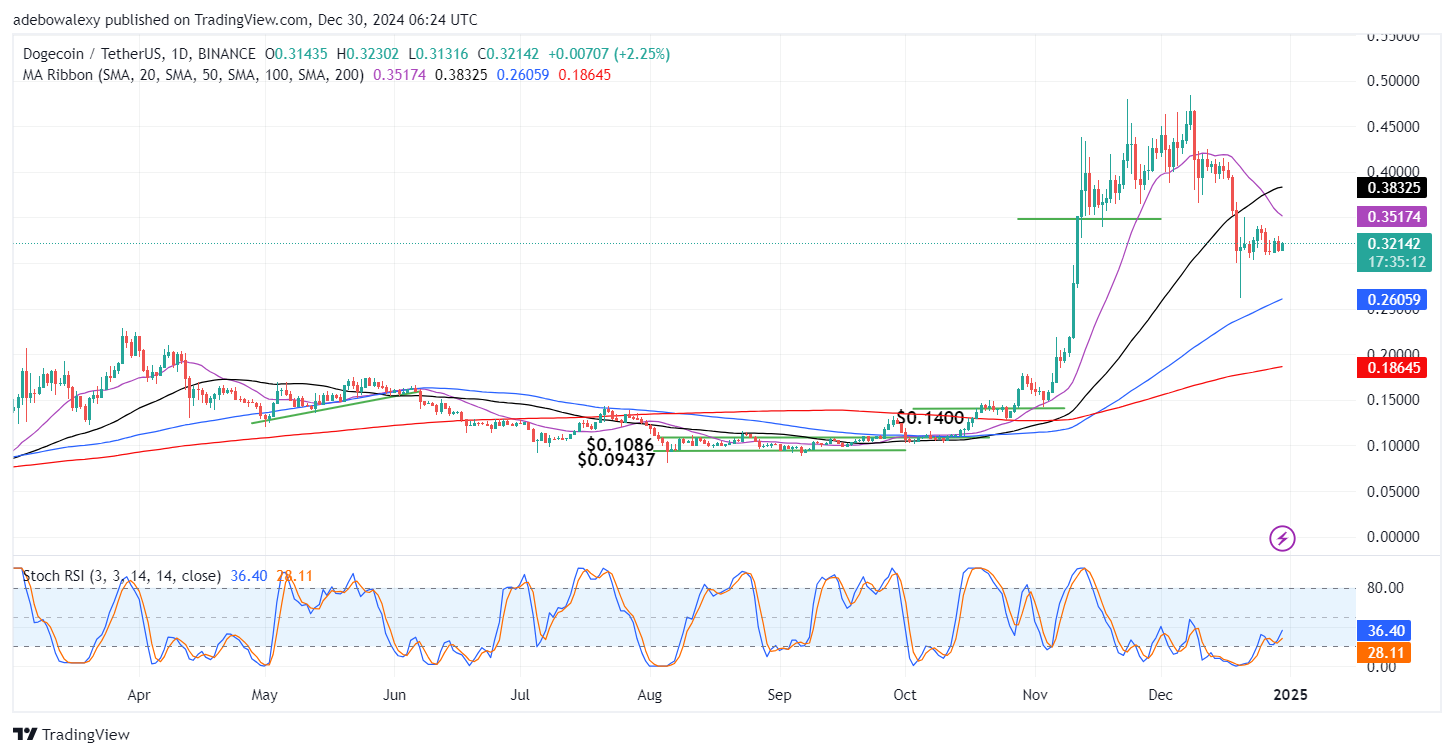
The corresponding price candle for the ongoing session is green, suggesting that upside forces are leading in the session. Also, price action lies between the 20-, 50-, 100-, and 200-day Moving Average (MA) lines. Additionally, the Stochastic Relative Strength Index (RSI) lines can be seen rising upward toward the 50 level of the indicator.
Dogecoin (DOGE) Price Prediction: DOGE/USDT Traders Face a Dicey Situation
Technically, price action in the Dogecoin daily market isn’t doing too badly at the moment. The only thing that can be noticed is that price activity needs catalysts for propulsion. The market has support above the $0.3000 price mark and stands between the MA lines. Meanwhile, the Stochastic RSI lines can be seen rising upwards following a recent crossover.
However, it seems price action isn’t recording much movement despite the crossover and activities of the RSI lines. This seems to be a result of the limiting effect of a recent crossover between the 20- and 50-day MA lines above price action.
Dogecoin (DOGE) Price Prediction: DOGE/USDT Is Consistent With Minimal Gains (4-Hour Chart)
Even in the Dogecoin 4-hour market, we can see that price action has continued to see minimal gains. The previous session presented a rebound off the support around the $0.3200 price level. Meanwhile, the last price candle has continued in the same direction, bringing the market above the 50-day MA line. Meanwhile, the Stochastic RSI lines have delivered an upward crossover just at the 20-level of the indicator.
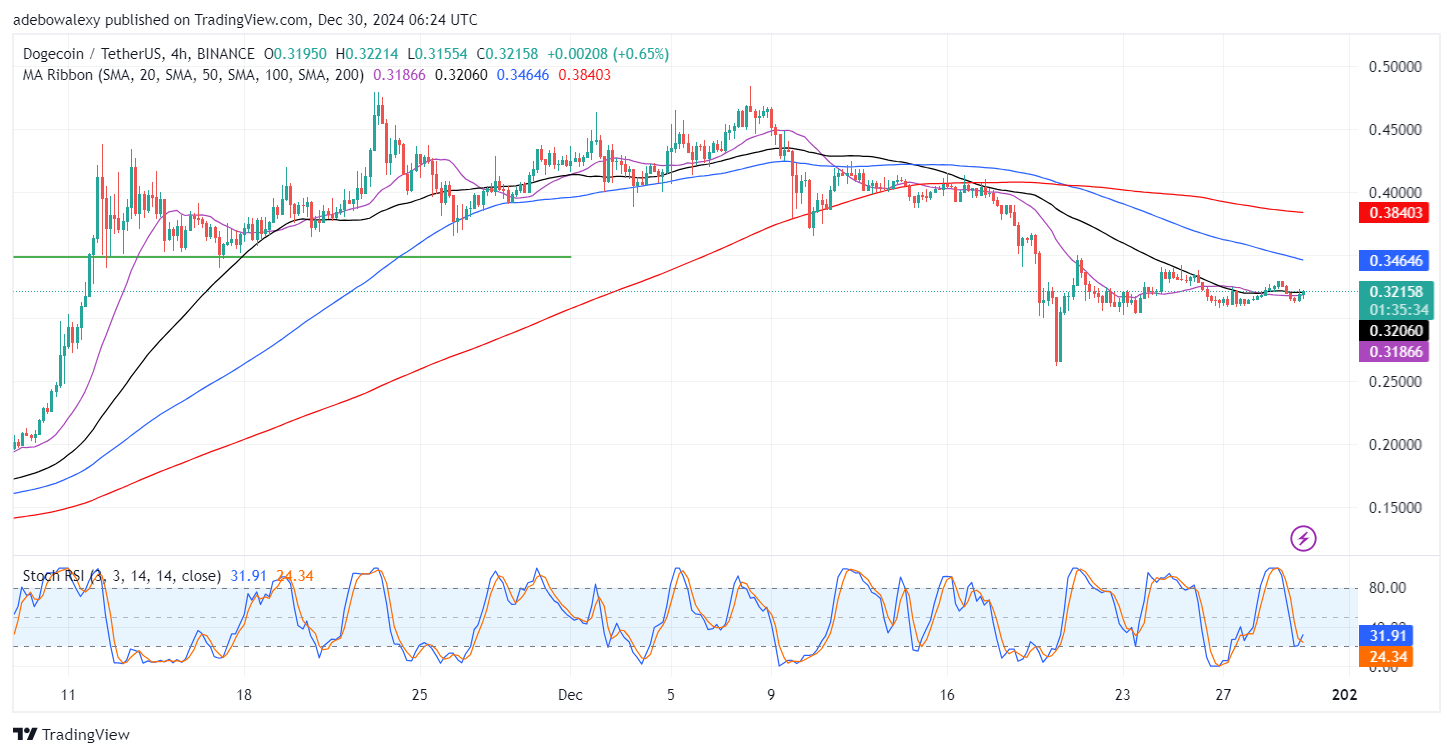
At this point, it does seem that this market has a short-term upward trajectory. The fact that price action has risen above the 20- and 50-day MA lines suggests that price action can move upward subsequently. However, it is safe to say that the market’s upward movement may be short-lived, and rejection may be seen around $0.3500 or at most $0.4000.