POL (ex-MATIC) Price Prediction: POL/USDT Maintain Last Defense Above the 100-Day MA
Estimated Reading Time: 3 minutes
Don’t invest unless you’re prepared to lose all the money you invest. This is a high-risk investment and you are unlikely to be protected if something goes wrong. Take 2 minutes to learn more

POL (ex-MATIC) Price Prediction (December 28):
The POL (ex-MATIC) market has been descending since the market exhausted its bullish potential at the $0.7000 price level. Price activity has been descending downhill. However, price action seems settled around the $0.4750 price level.
POL/USDT Long-Term Trend: Bearish (Daily Chart)
Key Price Levels:
Resistance: $0.5000, $0.5500, $0.6000
Support: $0.4500, $0.4000, $0.3500
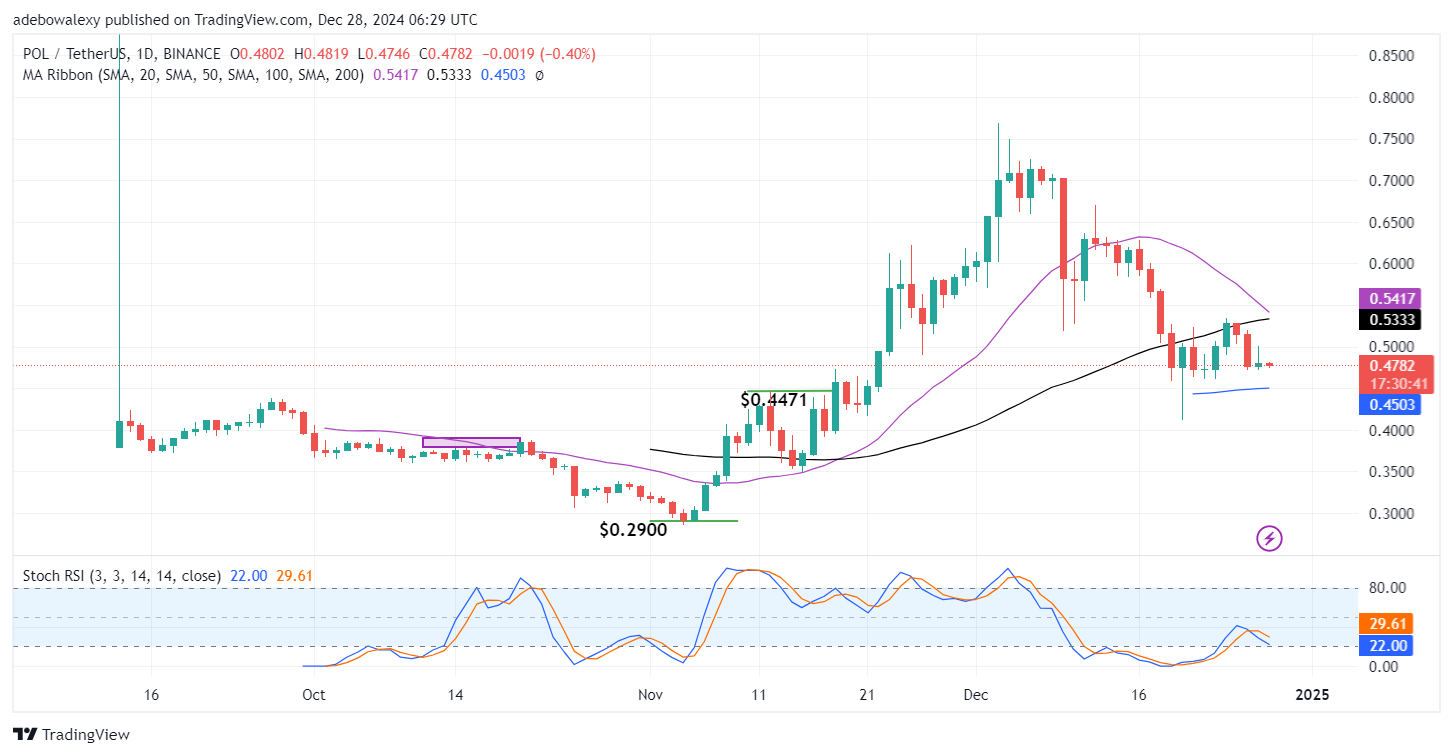
POL (ex-MATIC) token can be seen trending mostly sideways in the ongoing session. The seen price consolidation since the past nine sessions has been occurring above the 100-day Moving Average (MA) lines. Also, the 20- and 50-day MA lines seem to be converging above more recent price candles. Meanwhile, the Stochastic Relative Strength Index (RSI) lines are falling slightly downwards toward the 20 mark of the indicator.
POL (ex-MATIC) Price Prediction: POL/USDT Has Bearish Potentials
The last price candle in the POL (ex-MATIC) market can be seen appearing red and, as such, shows that downward forces are taking effect. Meanwhile, the market still stands above its last defense at the 100-day MA line. The convergence of the 20- and 50-day MA lines above price action seems to be constituting some bearish pressure on price movement in the market.
Also, the Stochastic RSI lines can be seen descending slightly toward the 20 level of the indicator. The price candle for the previous session can be seen to have tested the resistance at the $0.5000 price level, and that level repelled the market, and the ongoing session has produced a minute of progress to that.
POL (ex-MATIC) Price Prediction: POL/USDT Bearish Potential Stays on (4-Hour Chart)
Coming to the POL (ex-MATIC) 4-hour market, it appears that bearish potentials are still very much viable. Here, price action has fallen below all the MA curves. Also, the 20- and 50-day MA lines can be seen converging above recently appearing price candles. Further, the Stochastic RSI lines are falling downwards following a failed bullish crossover.
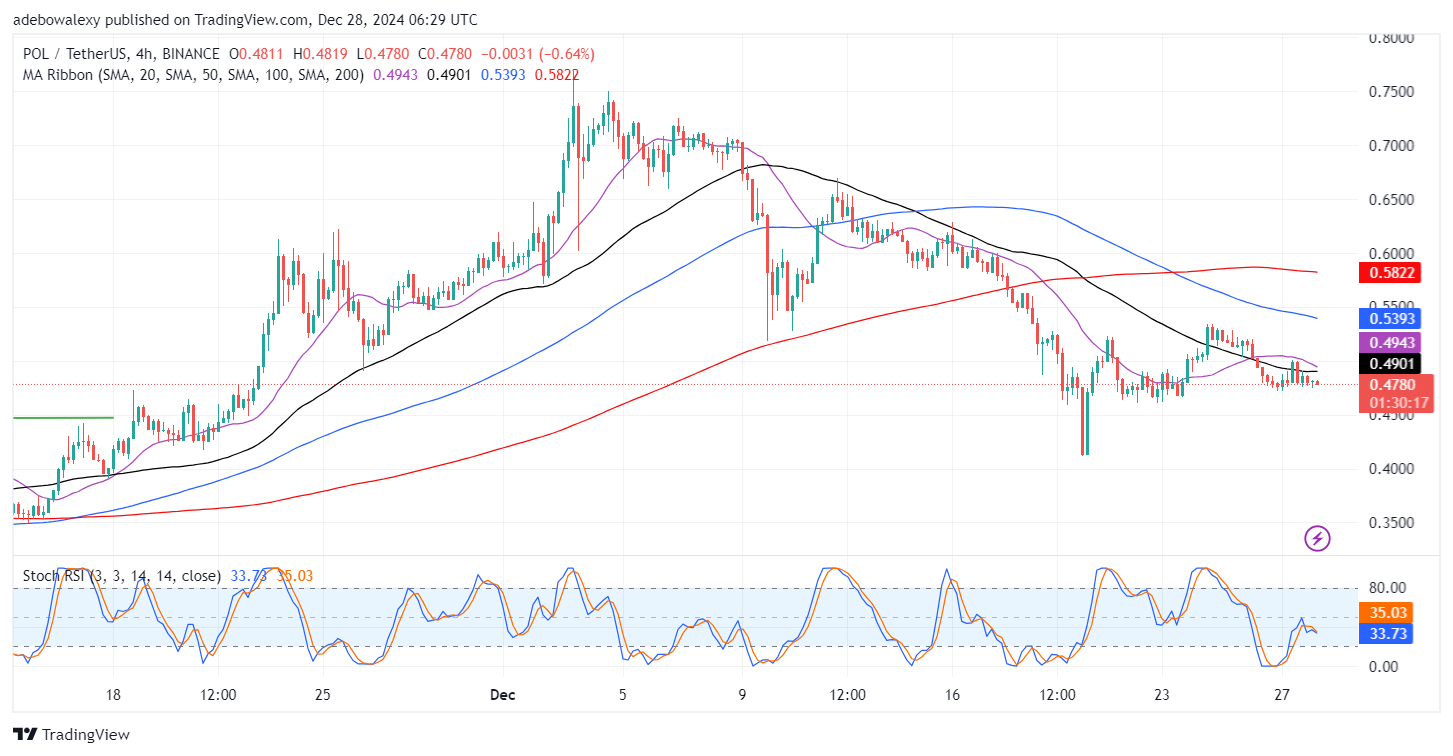
At this point, available indications suggest that downward forces are more likely to prevail in this market. The failure of the Stochastic RSI lines to initiate a bullish crossover hints that headwinds are strong. Likewise, the convergence of 20- and 50-day MA lines further strengthens bearish potentials in this market. Therefore, market participants can brace for impact at the $0.4500 support level.
Get POL (ex-MATIC) here. Buy POL