Solana Price Prediction: SOL/USDT Stays Under Pressure Just Above $185
Estimated Reading Time: 3 minutes
Don’t invest unless you’re prepared to lose all the money you invest. This is a high-risk investment and you are unlikely to be protected if something goes wrong. Take 2 minutes to learn more

Solana Price Prediction (December 27):
Ever since price action tapped out at the $260 resistance level, the Solana market has been making lower lows. The market has just rebounded off a low at the $180 price level. Let’s take a closer look at where the market may head shortly.
SOL/USDT Long-Term Trend: Bearish (Daily Chart)
Key Price Levels:
Resistance: $200, $220, $240
Support: $190, $180, $170
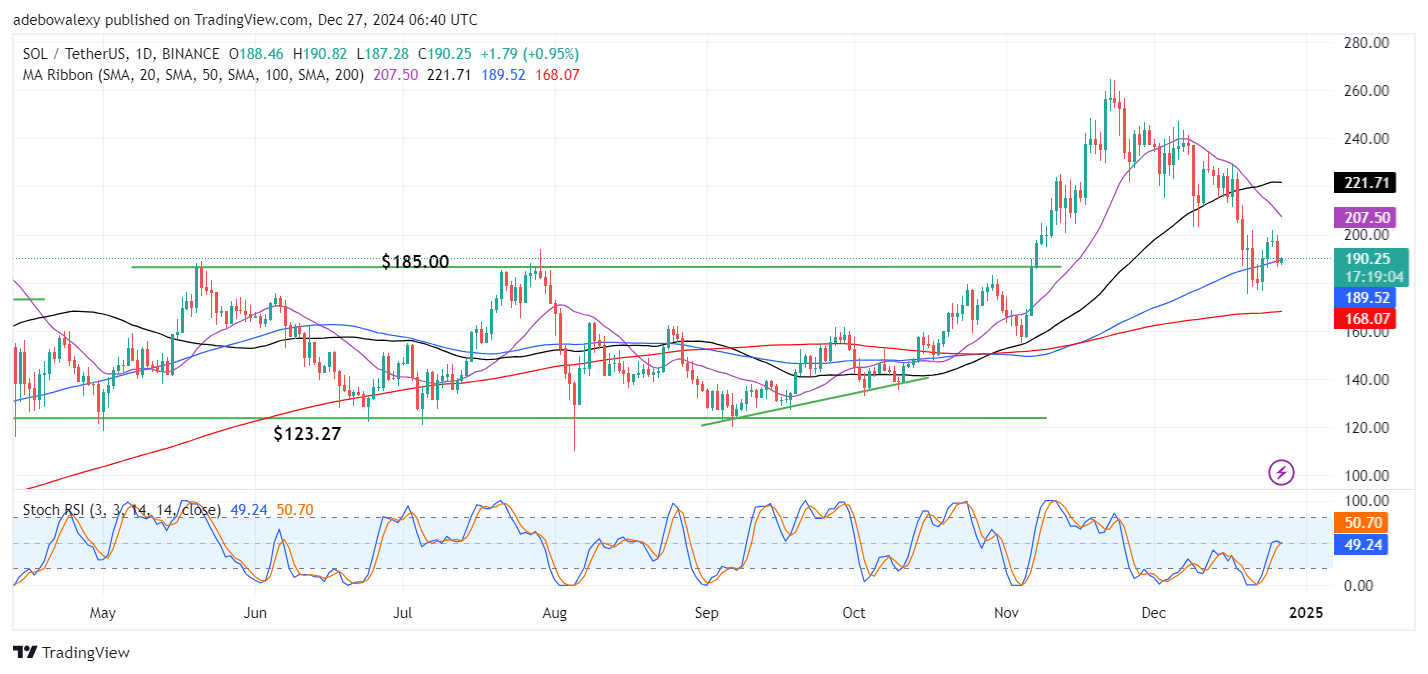
The Solana market had rebounded off the $200 resistance strongly in the previous session. Meanwhile, the ongoing session has rebounded upward through the 100-day Moving Average (MA) line. As a result, price action stays above the two-month-old support at the $185 price level. Meanwhile, the Stochastic Relative Strength Index (RSI) lines can be seen to have converged just at the 50 level of the indicator.
Solana Price Prediction: SOL/USDT Minute Gains Seem Vulnerable
From the daily Solana price chart, it could be perceived that price action has seen a minimal upside retracement. However, this upside retracement seems so small that it can still be overpowered by the more dominant market sentiment. The last price candle on the chart has only placed the token’s price just above the 100-day MA lines.
Meanwhile, the Stochastic RSI lines have just delivered a crossover at the 50 mark of the indicator. The direction of the ensuing lines is still unclear, and the appearance of the last price candle on the chart seems to complicate the matter. However, since price action seems to be making some progress lately, traders can anticipate some more positive retracement here.
Solana Price Prediction: SOL/USDT Market Persistently Clinches Minimal Gains (4-Hour Chart)
Even in the Solana 4-hour market, bulls continue to record minimal gains. Here, the last two prices have appeared green. The latest price candle appears higher than the previous one. At the same time, the Stochastic RSI lines are rising steadily from the indicator’s oversold zone. However, price action appears below all the MA curves on the chart.
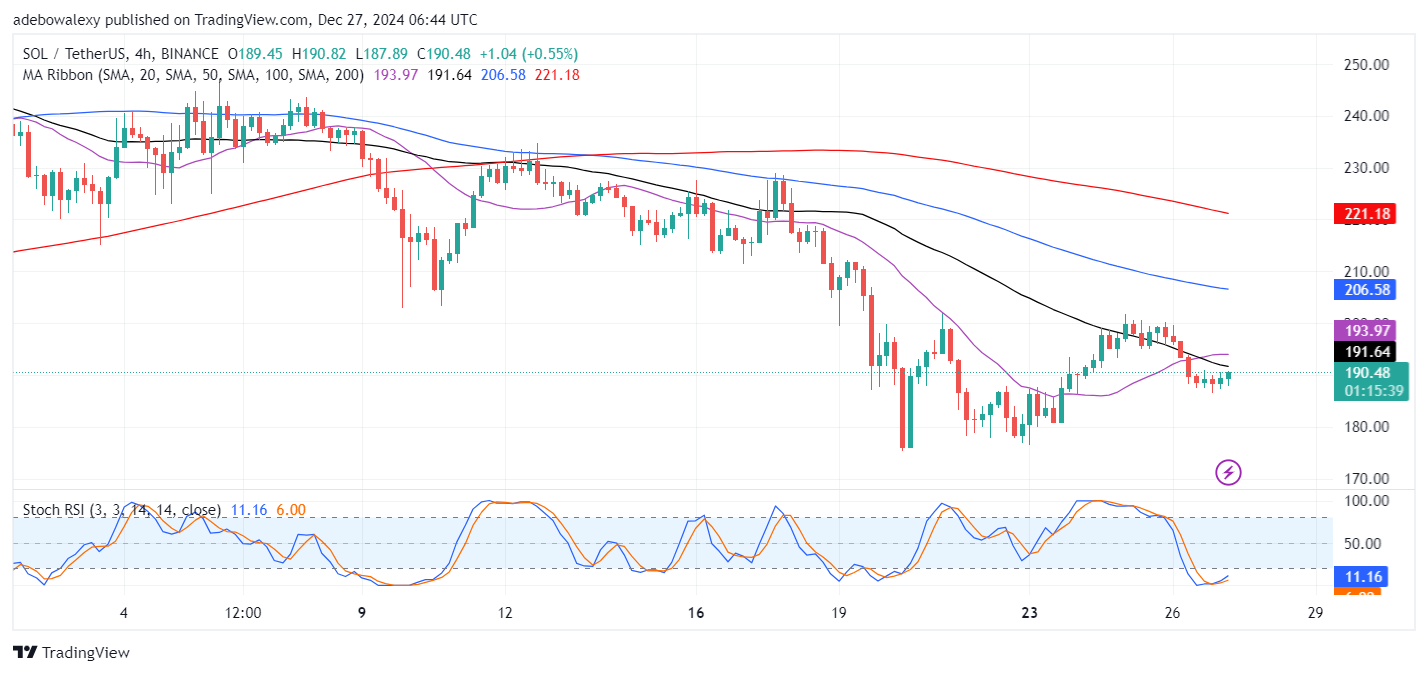
Given the indications on the 4-hour price chart, headwinds seem to have a threatening look given the oversold condition and the position of price action. With price action below all the MA lines, it appears that price activity remains under pressure. However, the upward trajectory of the RSI lines suggests that this market has a short-term upward trajectory, at least towards the $200 mark.