Ripple (XRP) Declines as Buyers Recoup above $0.61 to Resume Uptrend
Estimated Reading Time: 2 minutes
Don’t invest unless you’re prepared to lose all the money you invest. This is a high-risk investment and you are unlikely to be protected if something goes wrong. Take 2 minutes to learn more

Ripple (XRP) Long-Term Analysis: Bearish
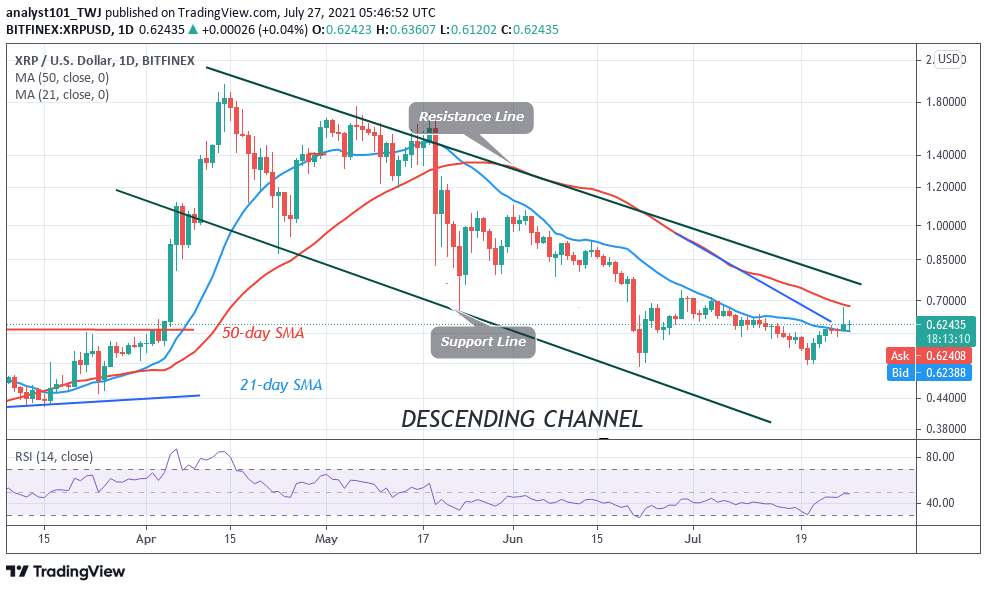
In its recent rally, Ripple’s (XRP) reached the high of $0.68. The uptrend was terminated as the altcoin fell to the support above $0.62. Buyers are recouping above the current support to resume an upward move. There is a possibility that Ripple will rally to $0.75 if buyers break the $0.68 high. A further upward move above $0.75 will push the altcoin to the high of $1.0.Nonetheless, if buyers fail to breach the $0.68 resistance, Ripple will revisit the previous low of $0.52 or $50. XRP/USD is trading at $0.64 at the time of writing.
Ripple (XRP) Indicator Analysis
The altcoin is at level 48 of the Relative Strength Index period 14. It indicates that the market is still in the downtrend zone and below the centerline 50. Ripple is above the 50% range of the daily stochastic. The altcoin is in a bullish momentum. Buyers have emerged in the oversold region. The moving averages are sloping downward indicating the downtrend on the daily chart.
Technical indicators:
Major Resistance Levels – $2.00, $2.50, $3.00
Major Support Levels – $1.50, $1.00, $0.50
What Is the Next Direction for Ripple (XRP)
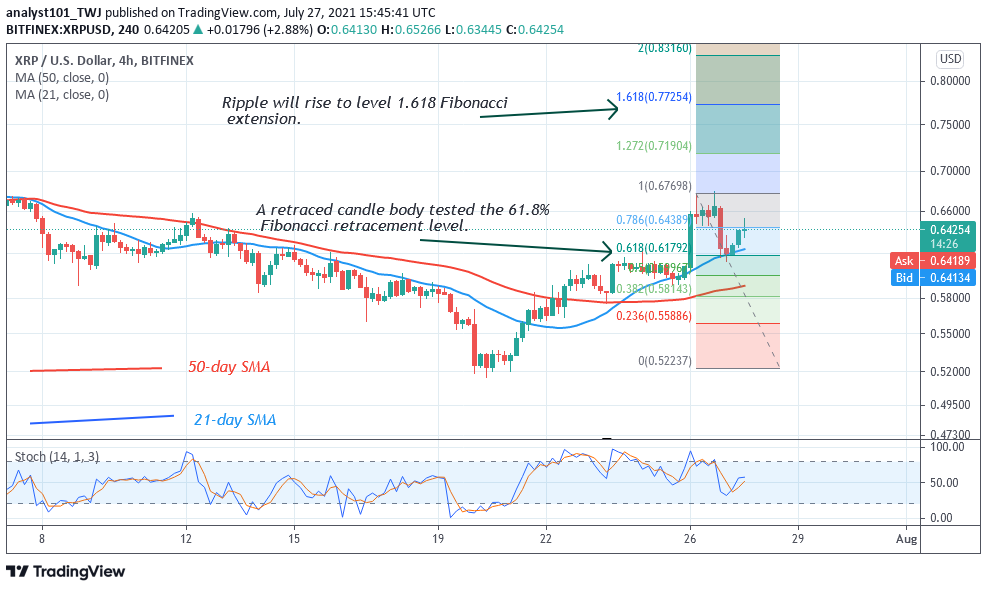
Ripple’s (XRP) price has resumed an upward move to retest the previous highs. Meanwhile, on July 26 uptrend; a retraced candle body tested the 61.8% Fibonacci retracement level. The retracement indicates that Ripple is likely to rise to level 1.618 Fibonacci extension or level $0.77. Ripple has retested the 2.0 Fibonacci extension and resumed upward.
You can purchase crypto coins here. Buy Tokens
Note: Cryptosignals.org is not a financial advisor. Do your research before investing your funds in any financial asset or presented product or event. We are not responsible for your investing results