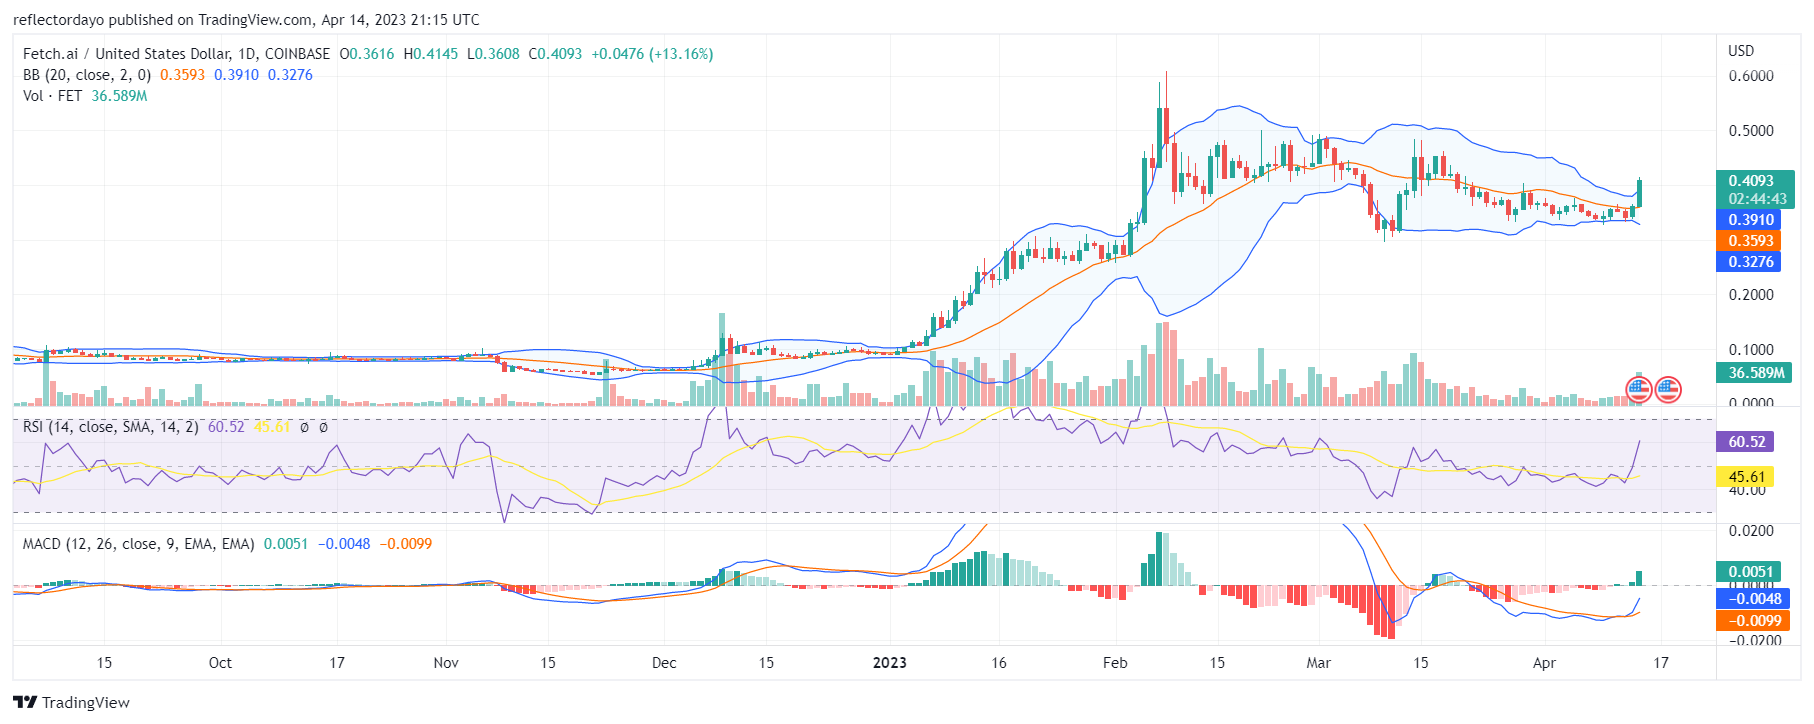
Fetch.ai (FETUSD) Boosts Out of the Sell Zone
Estimated Reading Time: 3 minutes
Don’t invest unless you’re prepared to lose all the money you invest. This is a high-risk investment and you are unlikely to be protected if something goes wrong. Take 2 minutes to learn more
The $0.452 price level has been a strong barrier for the Fetch.ai market since mid-March. The bull rush was triggered at the $0.317 price level after the strong bear market hits the demand level. Then, from this level, a significant bull market charge is made to reclaim $0.4863. This was not possible for the bull as the bears adopted a lower supply level of $0.452.
FET/USD Price Statistics
- FET/USD Price Now: $0.4092
- FET/USD Market Cap: $334,823,108
- FET/USD Circulating Supply: 818,912,300 FET
- FET/USD Total Supply: 1,152,997,575
- FET/USD CoinMarketCap Ranking: #119
Key Levels
- Resistance: $0.45, $0.50, and $0.55
- Support: $0.40, $0.35, and $0.30
Price Prediction for Fetch.ai: The Indicators’ Point of View
The lower high is supposed to put more pressure on the demand line as bears attempt to drive the price further to the downside. However, we noticed that the demand level also shifted slightly from $0.3194 to $0.3423. By the end of March, we saw another lower high at the $0.39 price level, but the new support level remained unaffected by the selling pressure. Finally, in today’s market, we have a breakout. The bulls propel the market out of the intensifying deadlock and set the market on the trail of the mid-March resistance level price, which is $0.4497. In the Relative Strength Index, the RSI line indicates a sharp rise. But according to the Bollinger Bands indicator, there is a spike in the market’s volatility. Also, the price action moving outside of the bands is a sign of the market being overbought. Traders might want to wait for the Moving Average Convergence and Divergence (MACD) line to confirm the bull market by crossing out of the sell zone before taking a decision.
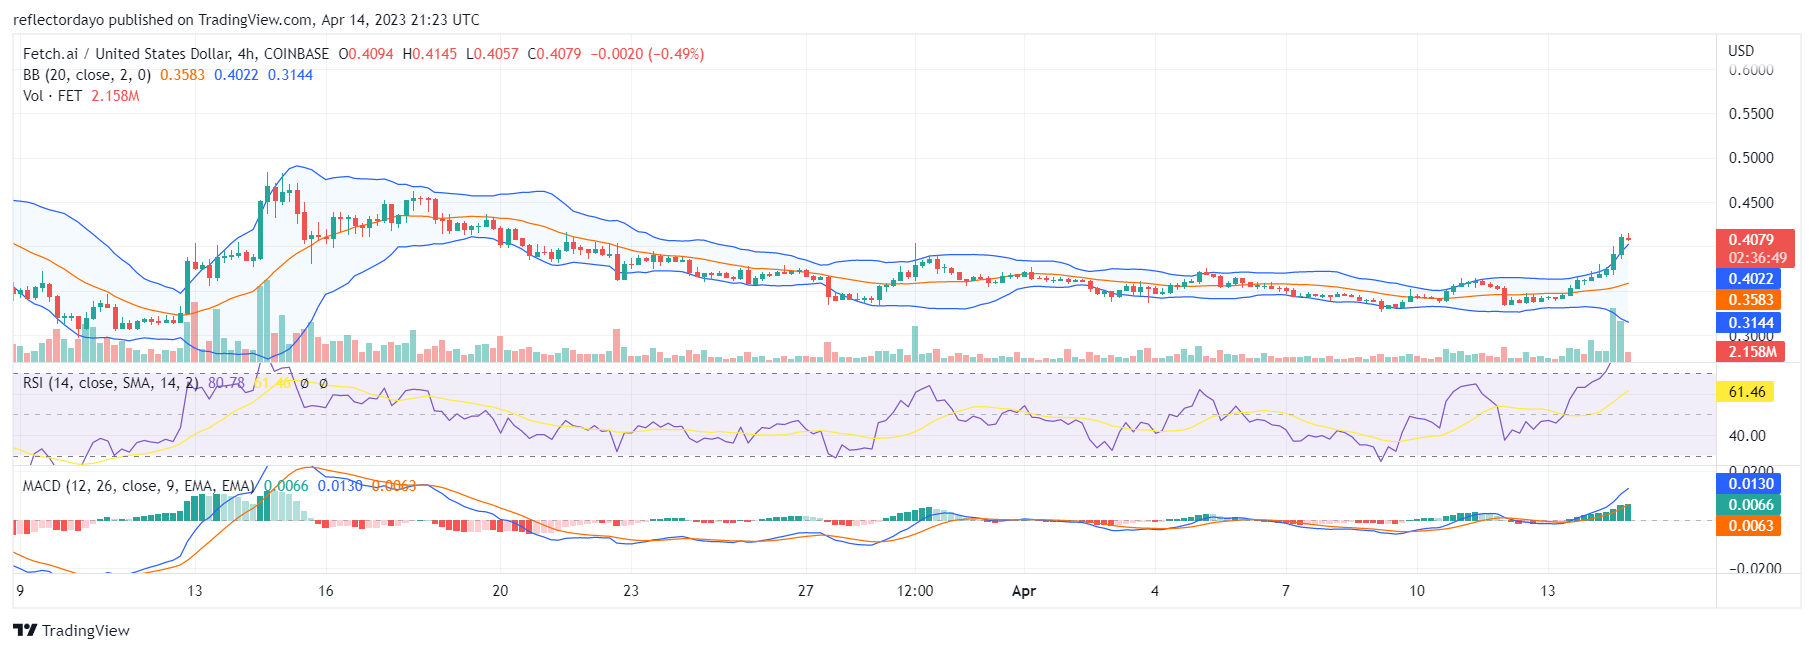
FET/USD 4-Hour Chart Outlook:
From this standpoint, it appears as though the bull market has hit a major price mark and might pull back. The latest four-hour candlestick pattern is a Doji, signifying a possible price pullback at this level. In confirmation of this, the Relative Strength Index indicates an overbought market. The market might pull back for a while before continuing its upside journey. The general sentiment for the Fetch.ai market is bullish.