Zcash (ZECUSD) Smashes Through the $39.72 Price Level
Estimated Reading Time: 3 minutes
Don’t invest unless you’re prepared to lose all the money you invest. This is a high-risk investment and you are unlikely to be protected if something goes wrong. Take 2 minutes to learn more
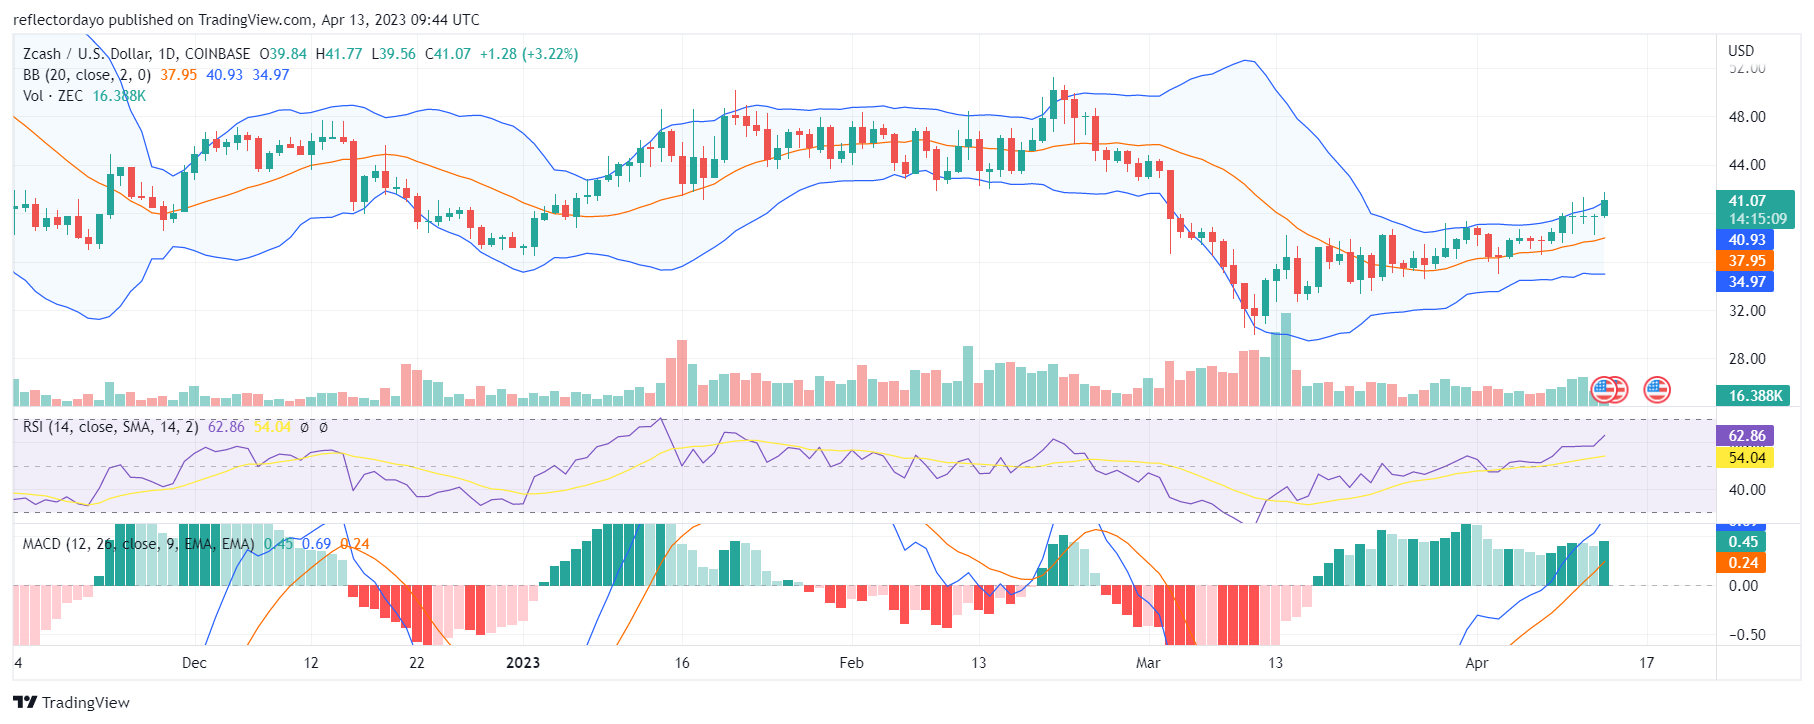
Zcash buyers lost grip on the market on February 21 as the bear market became aggressive at the high of $50.36. The bearish price smashed through the support level with very significant momentum. The bears dragged the bulls further to the downside until the bulls were able to find their footing at $31.56 on March 12. Since then, the bull market has been on a steady recovery. Even though the hyper-bearish market ought to trigger aggressiveness on the side of the bulls, instead, the bull market has been on a steady and progressive recovery.
ZEC/USD Price Statistics
- ZEC/USD Price Now: $41.47
- ZEC/USD Market Cap: $673,497,405
- ZEC/USD Circulating Supply: 16,328,269 ZEC
- ZEC/USD Total Supply: 16,328,269
- ZEC/USD CoinMarketCap Ranking: #73
Key Levels
- Resistance: $44.00, $46.00, and $47.00
- Support: $35.00, $30.00, and $25.00.
The Indicators’ Point of View: Zcash Smashes Through a Major Barrier
During the massive drop in the price in early March, the Bollinger Bands indicator portrays high volatility as the bands expand significantly, even though the price has declined sharply. That means there could be another reason for the massive selling because, at this time, some traders are still bullishly biased on the market, resulting in high volatility at the time. After the bulls were able to get themselves back into the game, they began to have a steady recovery. This time around, the Bollinger Bands indicator contracted, signifying a decline in the market’s volatility. As the bull market hit the key resistance level, which is $39.72, the market went flat for three days due to a gridlock struggle between demand and supply before it finally smashed through the key resistance in today’s market session.
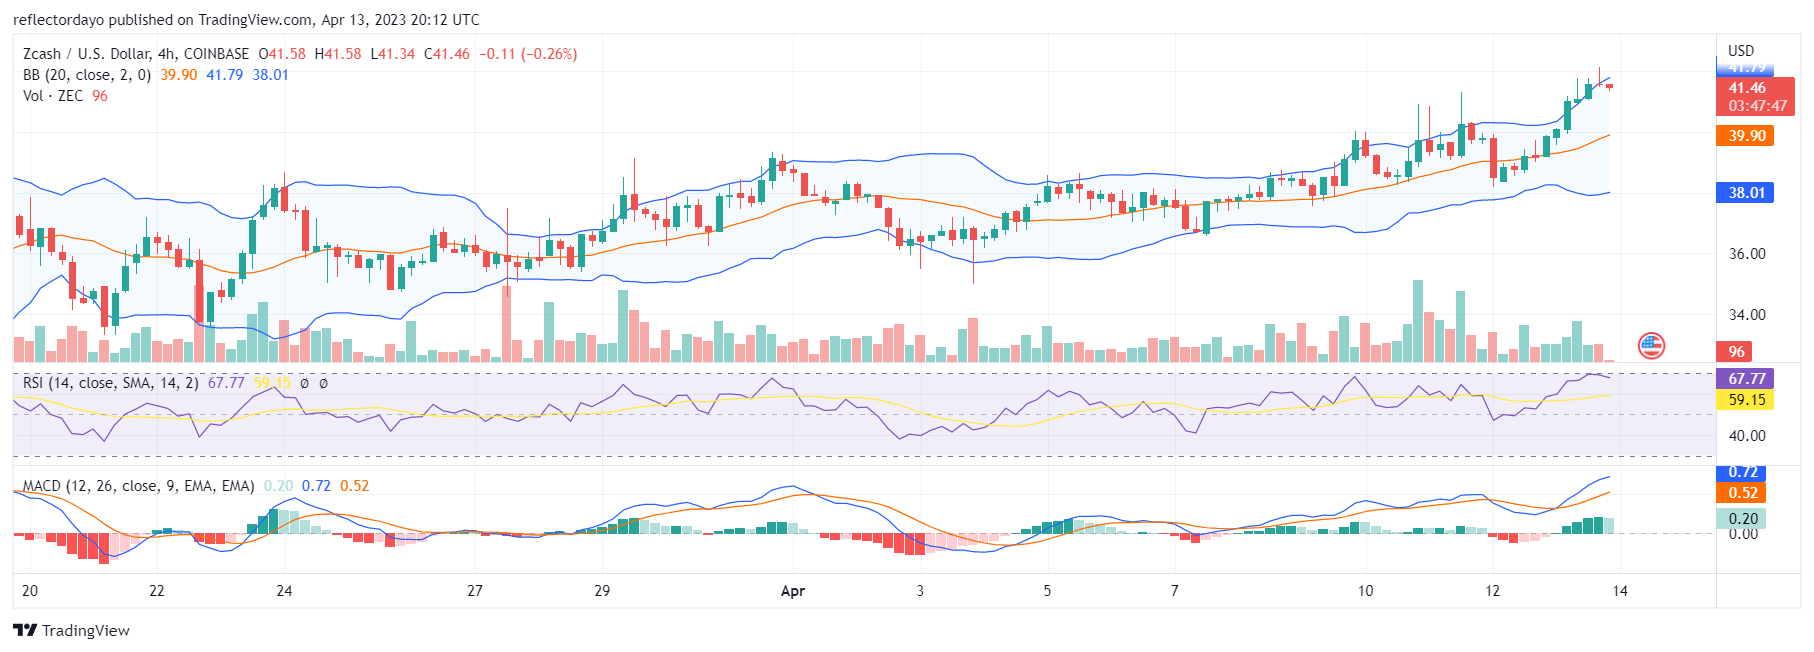
ZEC/USD 4-Hour Chart Outlook:
From a 4-hour point of view, the market is clearly in an uptrend as it continues to have higher lows. Along the way, the market hits major psychological levels, which result in a number of brief price pullbacks, but the bulls are able to maintain a higher support level on each of the occasions of the pullback. Again, the market appears to have hit another major resistance level at around $41.16, and the market appears to be pulling back. However, judging from the historical performance of the market since its recovery, we can expect that the trend will continue.