Litecoin (LTC/USD) Market Converges Above $60
Estimated Reading Time: 3 minutes
Don’t invest unless you’re prepared to lose all the money you invest. This is a high-risk investment and you are unlikely to be protected if something goes wrong. Take 2 minutes to learn more
Litecoin Price Prediction – November 22
The recent buying forces in the LTC/USD trade operations have witnessed a pit stop around the $65 resistance line as the crypto market converges above the $60 point. As of the time of writing, the price is trading around $61.89 at an average rate of 1.05 percent.
LTC/USD Market
Key Levels:
Resistance levels: $65, $70, $75
Support levels: $55, $50, $45
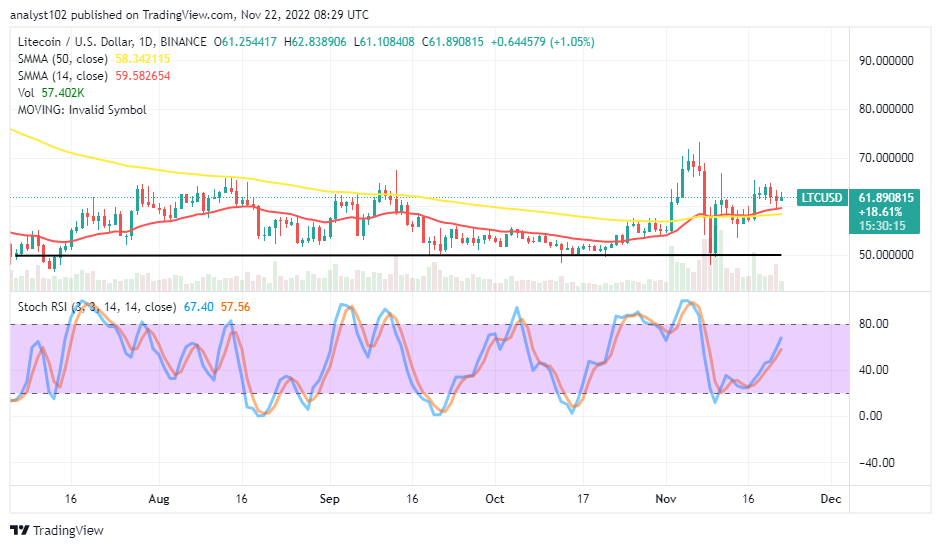
LTC/USD – Daily Chart
The LTC/USD daily chart showcases that the crypto market converges above the $60 level against the US Dollar. The 14-day SMA indicator is at $59.582654, slightly above the $58.342115 value point of the 50-day SMA indicator. The baseline remains drawn around the $50 support level. Stochastic Oscillators have extended their lines northbound from the 20 levels to 57.56 and 67.40 levels. That indicates buying force is still relatively playing in the trade.
Will the LTC/USD market continue to gain traction around the SMA trend lines?
Traders in the LTC/USD market operations need to wait for a powerful-price action to drive the price into a definite direction from around the current convergence-trading spot as the crypto economy converges above the $60 line at a closure technical analytics point of view. If a move occurs falsely forceful to the downside against the near value line mentioned, it will be the turn of a rebound to prevail subsequently in the operations. Long-position placers must therefore keep an eye out for that presumption to materialize to profit later.
On the downside of the technical analysis, the LTC/USD trade sellers will have to wait for a descending pattern to form using the reading of the Stochastic Oscillators in the overbought region as a yardstick to determine when bulls’ weakness will maximally confirm. In the meantime, the resistances between $65 and $70 will not be easy zones for obtaining sustainable ups. Retracements will likely follow when the price encounters resistance around those points.
LTC/BTC Price Analysis
In comparison, Litecoin has continually demonstrated a high-powering motion against Bitcoin’s weaknesses. The former trading instrument is waxing firmer in a straight-line path against the latter cryptocurrency over the trend lines of the SMAs. The 14-day SMA indicator is above the 50-day SMA indicator. The Stochastic Oscillators are around 83.34 and 8823 levels in the overbought region. Variant bullish candlesticks have been purposely to indicate that the base crypto isn’t yet ready to surrender to any declining force the counter crypto may intend to come up about.
Note: Cryptosignals.org is not a financial advisor. Do your research before investing your funds in any financial asset or presented product or event. We are not responsible for your investing results.
You can purchase Lucky Block here. Buy LBLOCK