Cardano Slides after Retesting the $0.30 Resistance Zone
Estimated Reading Time: 2 minutes
Don’t invest unless you’re prepared to lose all the money you invest. This is a high-risk investment and you are unlikely to be protected if something goes wrong. Take 2 minutes to learn more

Cardano (ADA) Price Long-Term Forecast: Bullish
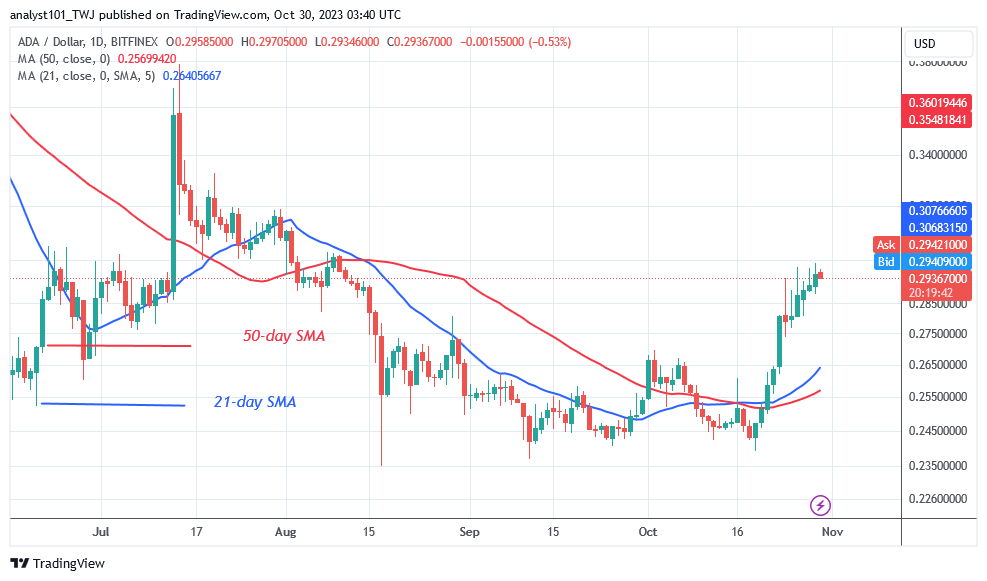
Cardano (ADA) price has fallen after retesting the $0.30 resistance zone. The positive momentum has also broken through the barrier level of $0.28. At the time of writing, the price of ADA is $0.2945. Since October 24, the rising trend has slowed as it trades below the $0.30 resistance level. The recent high represents an overbought market zone.
On the plus side, the bulls have yet to break through the $0.30 barrier since July 31. ADA/USD was in decline in the previous price action, falling to a low of $0.23 on August 17. The bullish momentum has slowed today as it approaches the $0.30 barrier level.
Technical Indicators:
Major supply zones: $1.0, $1.05, $1.10
Major demand zones: $0.25, $0.20, $0.15
Cardano (ADA) Indicator Analysis
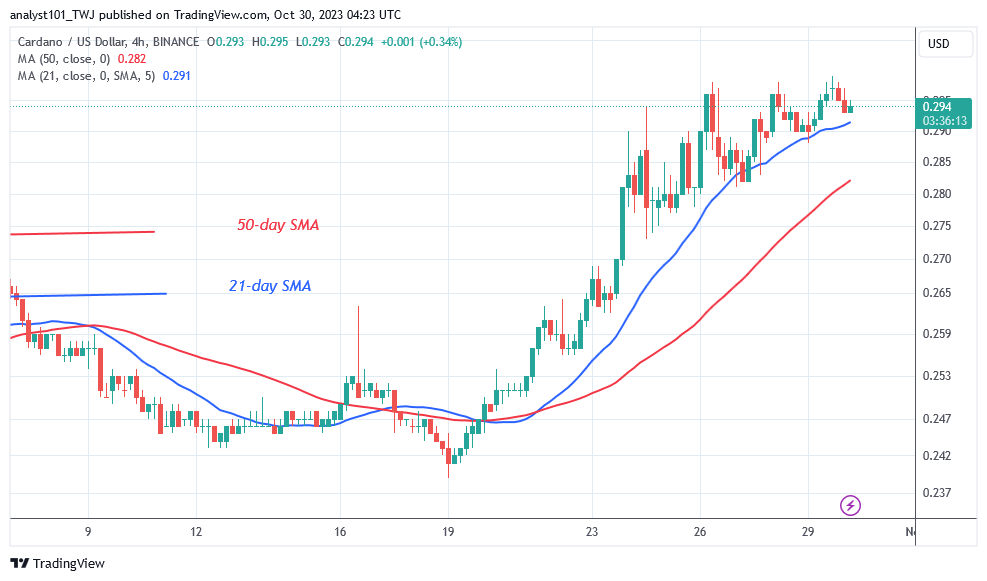
Cardano’s price bars are well above the moving average lines, but the market has become overbought. The price bars on the 4-hour chart are retesting the 21-day SMA to breach below it. When the cryptocurrency is rejected at the resistance zone, it will decline and then rebound above the 21-day SMA. When the moving average lines cross, the selling pressure will restart.
What Is the Next Move for Cardano (ADA)?
Cardano is currently trading below the barrier level after retesting the $0.30 resistance zone. The increasing trend came to an end on October 29, when ADA reached a high of $0.2989. Today, the altcoin is sliding after breaking through the $0.30 resistance level. The ADA/USD may fall as the market approaches overbought territory.
You can purchase crypto coins here. Buy LBLOCK
Note: Cryptosignals.org is not a financial advisor. Do your research before investing your funds in any financial asset or presented product or event. We are not responsible for your investing results