Polkadot (DOT/USDT) Seeks to Build a Base Above $3.622 for a Potential Reversal
Estimated Reading Time: 3 minutes
Don’t invest unless you’re prepared to lose all the money you invest. This is a high-risk investment and you are unlikely to be protected if something goes wrong. Take 2 minutes to learn more
Polkadot Long-term Analysis: Consolidating
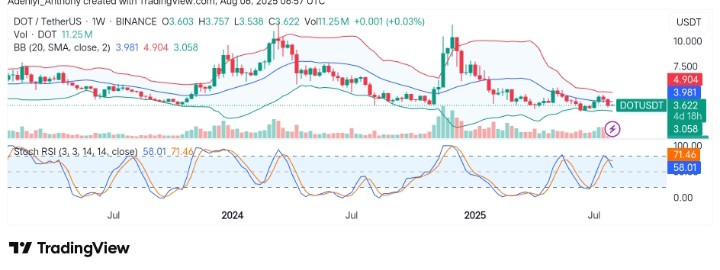
At the moment, the market sentiment around Polkadot against Tether appears to be cautiously optimistic. Recently, the pair’s price has displayed signs of range-bound activities, nestled within the lower part of the Bollinger Bands while showing an upward trend in momentum. However, as it stands, the Stochastic RSI seems to be indicating a drop in momentum, creating a delicate condition as the bands narrow.
Currently, the pair operates under the dynamic line at $3.981 with signs of a potential upside movement despite the indication from the Stochastic RSI. To this end, Polkadot trades at $3.622, recording over 11.5 million traded volumes for the week.
Technical Indicators
Major Resistance Levels: $3.981, $4.500, and $5.000
Major Support Levels: $3.500, $3.400, and $3.050
Polkadot Technical Analysis
The analysis of Polkadot against Tether on the weekly timeframe shows the pair is currently at a critical juncture, aiming to build a base at the current level for an upward trajectory above $3.981. However, the constriction of the Bollinger Bands indicates a reduced volatility, though with the possibility of a potential breakout ahead.
Also, the Stochastic RSI signals reduced bullish momentum as the lines dropped into the 70-mark level despite the volume recorded so far this week. As it stands, the pair’s next direction depends on whether Polkadot gains more bullish attention for a move above $3.981 or receives more bearish support for a breakdown below $3.500; otherwise, the current sideways movement continues.
DOT/USDT Daily Analysis: What’s Next?
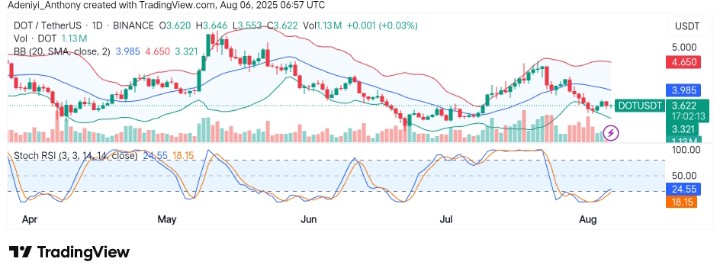
On the daily chart, DOT/USDT appears to be getting the attention of the bullish traders as the pair’s value builds on $3.322 despite bearish efforts to extend the movement south. Also, the bands appear to be expanding, suggesting increased volatility as the pair records more than a million traded volumes already.
From another angle, the Stochastic RSI signals the pair is improving, though with the possibility of continued consolidation, as the line of the indicator is positioned in the oversold region. To this end, as the DOT records more volumes, a break above $3.800 would confirm a bullish move; otherwise, a break below $3.322 would indicate a decline.
You can purchase crypto coins here. Buy LBlock