Immutable X (IMX) Is Ready for a Bullish Action
Estimated Reading Time: 2 minutes
Don’t invest unless you’re prepared to lose all the money you invest. This is a high-risk investment and you are unlikely to be protected if something goes wrong. Take 2 minutes to learn more
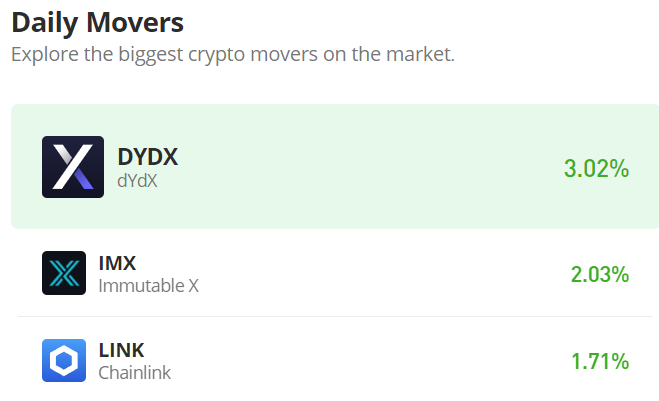
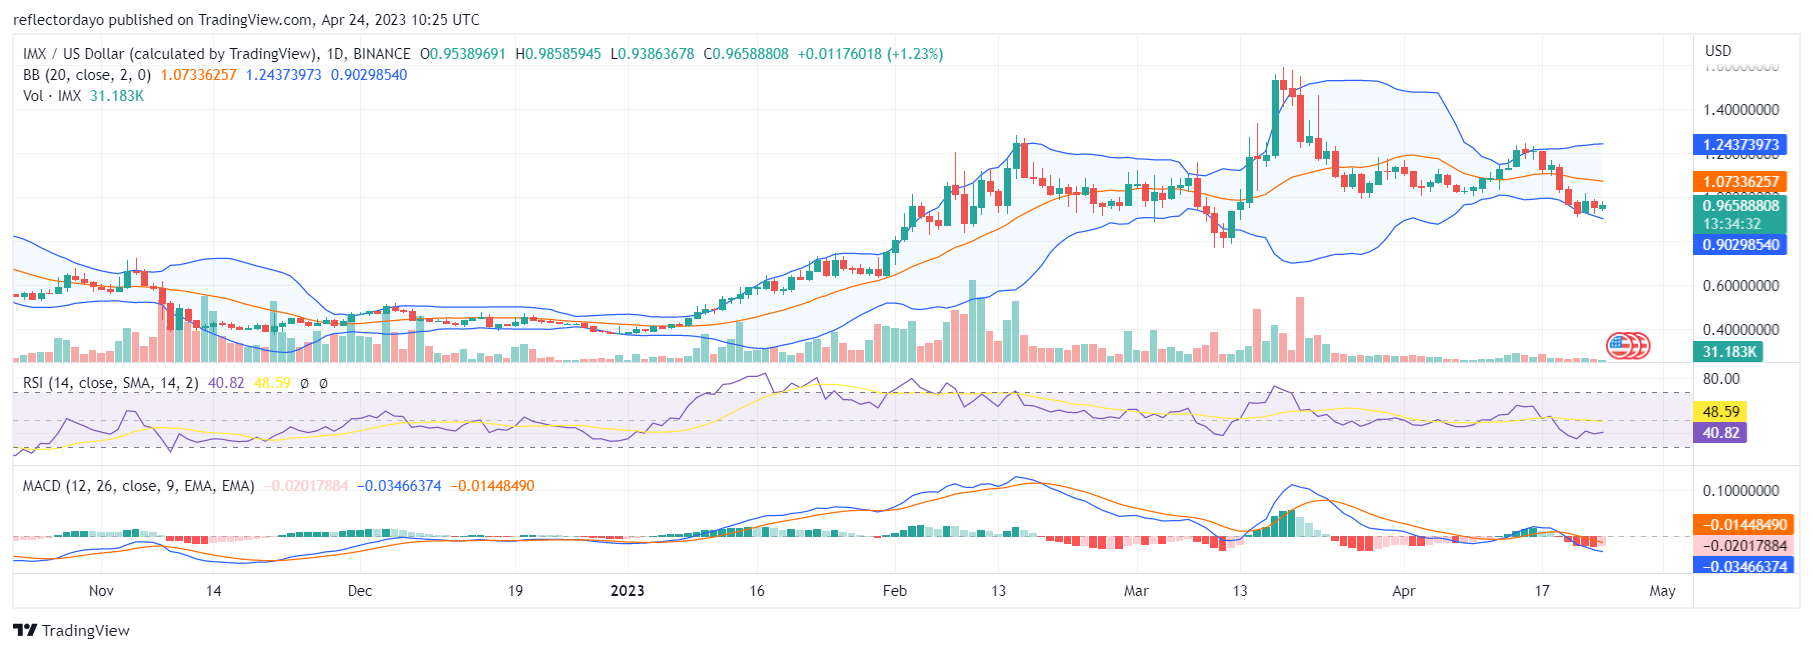
An attempt made by Immutable X buyers to bounce back to March 17’s $1.533 price level failed as the bullish price was rejected around the $1.225 price level. This near-resistance level forced the bulls to shift below their key support level. Currently, the IMX buyers have found a suitable price to act as a strong support level. It is the $0.924 price level; from here, the market should be turned around to the upside.
IMX/USD Price Statistics
- IMX/USD Price Now: $0.9659
- IMX/USD Market Cap: $880,8693,353
- IMX/USD Circulating Supply: 915,163,546 IMX
- IMX/USD Total Supply: 2,000,000,000
- IMX/USD CoinMarketCap Ranking: #57
Key Levels
- Resistance: $1.00, $1.10, and $1.20
- Support: $0.85, $0.80, and $0.75
Price Prediction for Immutable X: The Indicators’ Point of View
While the Bollinger Bands portray a horizontally moving price channel, the recent bear market appears to have attempted to turn the market to the downside. This was illustrated by the lower standard deviation curve as it moves in a downward direction. However, the activities of the bulls are aborting the bearish move. Traders are not willing to buy below $0.9244. Although, according to the Moving Average Convergence and Divergence (MACD) indicator, the market continues to range at level 40, this should precede the bullish trend.
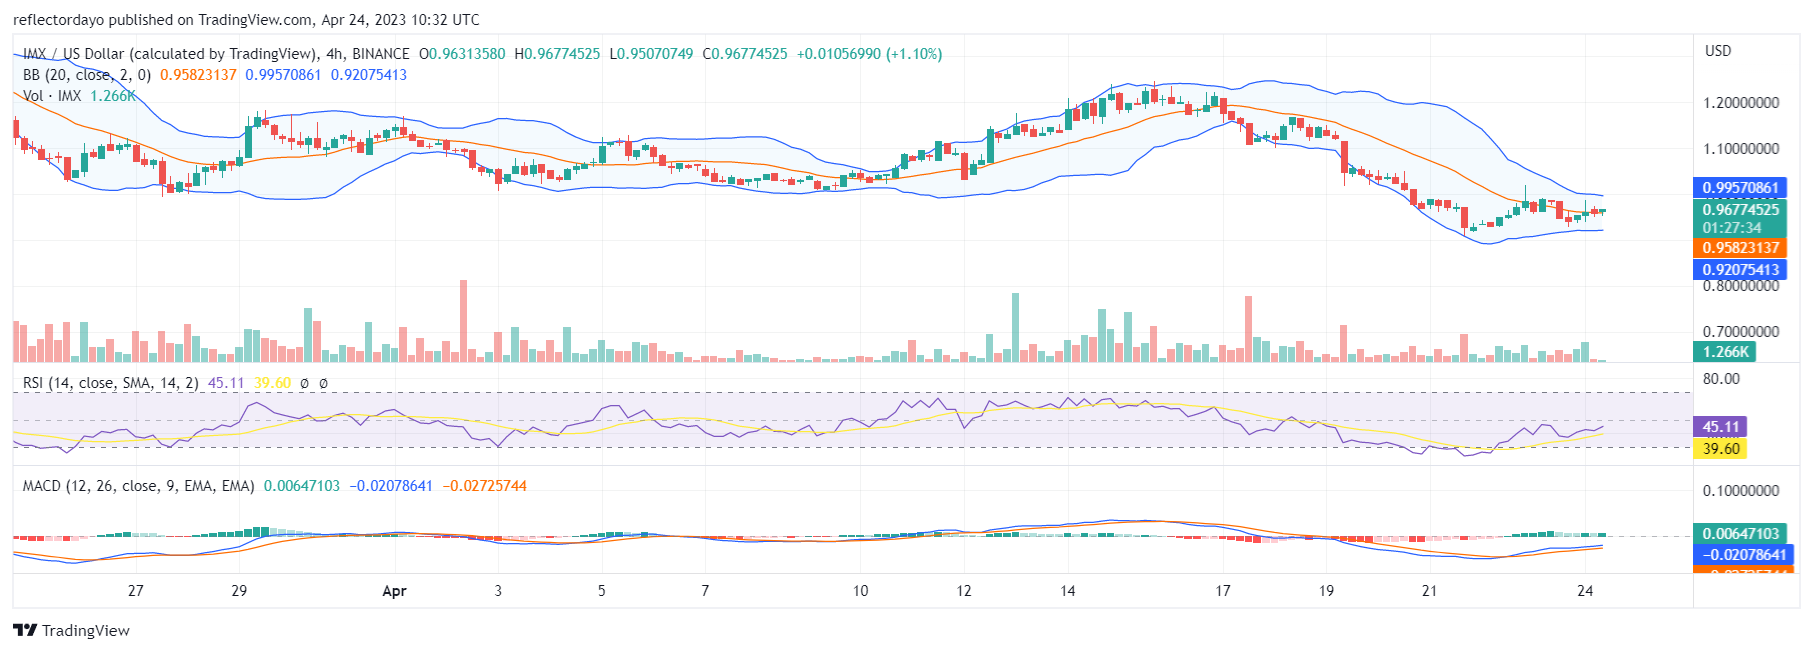
IMX/USD 4-Hour Chart Outlook:
From the 1-hour chart point of view, we can see that any time soon, the market may turn to the upside. The Bollinger Bands contract, and this will eventually result in a clear directional movement, which could be an upward movement. In support of this, the Relative Strength Index shows a recovering bull market. The selling pressure is reducing as the RSI line now measures 44.71. Traders are targeting March 17’s price, which is $1.533.