Polkadot (DOT/USDT) Consolidates at Key Support as Price Action Signals Further Decline
Estimated Reading Time: 3 minutes
Don’t invest unless you’re prepared to lose all the money you invest. This is a high-risk investment and you are unlikely to be protected if something goes wrong. Take 2 minutes to learn more
DOTUSDT Long-term Analysis: Bearish
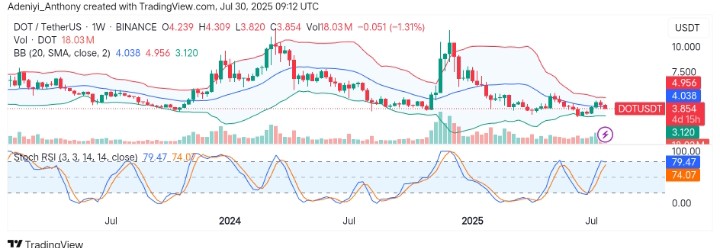
The market sentiment for the crypto trading pair Polkadot against Tether appears to be neutral to bearish in the short term, as downward pressure is evident following the last price peak. However, the price is below the 20-period moving average and is testing the lower Bollinger Band.
From another perspective, the recent price action shows consolidation. Still, there’s potential for further downside if the support levels are broken as the Stochastic RSI signals drop in momentum from the overbought zone.
To this end, the pair might see a possible pullback or correction if the support levels fail to hold.
Currently, Polkadot trades at $3.854, with over 18 million traded volumes for the week.
Technical Indicators
Major Resistance Levels: $4.956, $4.309, and $4.500
Major Support Levels: $3.850, $3.500, and $3.120
Polkadot Technical Analysis
Given the condition above, Polkadot against Tether appears to be heading south; the Bollinger Bands indicate that the price is near the lower end, suggesting the market could be oversold. However, a reversal could occur if the price finds support at $3.854 or $3.500. This suggests the market is indecisive at the moment.
On the other hand, the Stochastic RSI shows that the market momentum is wearing out as lines indicate a flattening out, indicating sellers’ activities in the market.
To this end, if the $3.500 support fails to hold, the pair may head further south.
DOT/USDT Short-Term Analysis: Pair Shows Reversal Potential
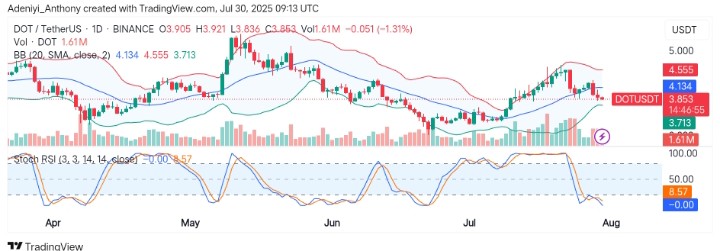
DOTUSDT on the daily chart is showing signs of weak bullish pressure as the bears exert more pressure on the market. However, with price action below the mid-band, the pair’s price plunges into the oversold session. This suggests the pair may see further fall or correction in the meantime.
On the other hand, the Stochastic RSI is currently in the oversold region, with lines pointing downward. This indicates a fall in momentum. However, the market could see a short-term reversal, possibly pushing the price back towards the upper range of the bands.
To this end, if the price holds above $3.853, a short-term recovery may occur; otherwise, more falls in value may be witnessed.
You can purchase crypto coins here. Buy LBlock